
Looking for a sleek, production-ready Vega-Lite Pareto chart template to elevate your Power BI (Deneb) or web dashboards? You are in the right place!
A Pareto Chart is based on the famous 80/20 Rule (the Pareto Principle): roughly 80% of consequences come from 20% of causes. This custom visual combines KPI summary cards, horizontal distribution bars, and a cumulative share curve into one seamless, high-impact design.
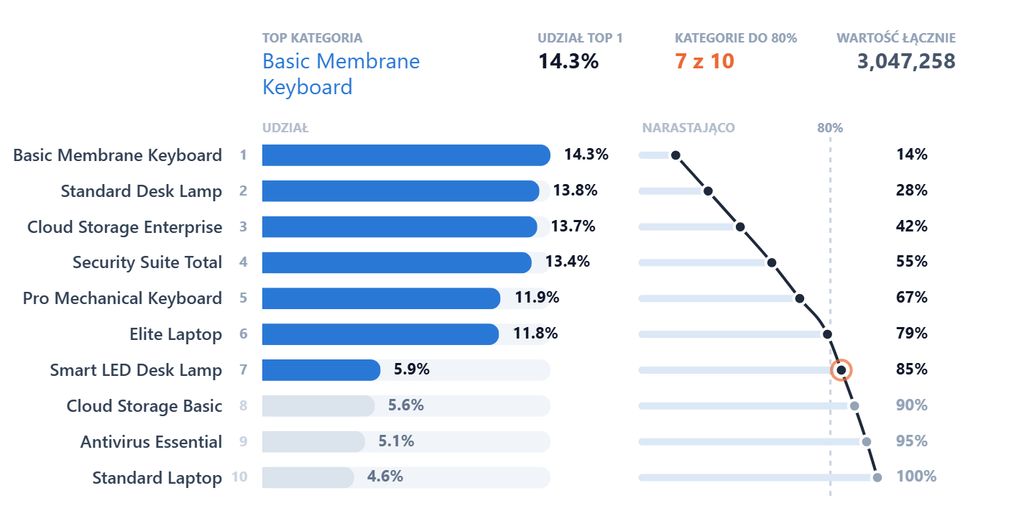
Table of Contents
🎯 When Should You Use a Pareto Chart? (Top Use Cases)
A Vega-Lite Pareto chart is ideal whenever you need to separate the „vital few” from the „trivial many”:
- 💰 Sales & Revenue (ABC Analysis): Identify the 20% of products or clients that generate 80% of your total revenue.
- 🐛 Bug & Support Ticket Prioritization: Discover which recurring software bugs account for the vast majority of customer complaints.
- 📦 Supply Chain & Inventory: Pinpoint high-cost inventory items eating up most of your warehouse budget.
- 👥 Marketing & Website Traffic: Uncover the few top-performing landing pages or campaigns driving the majority of leads.
🛠️ How to Implement This Template (3 Quick Steps)
💡 Universal Code Notice: This JSON template is 100% plug-and-play. It works with any dataset — you just need two fields: a text/category column and a numeric value column.
Follow these steps to plug this Vega-Lite Pareto chart into your project:
- First, prepare your data fields: Ensure your visual dataset has two columns:
Category(e.g., Product Name, Country, Issue Type)Value(e.g., Sales Amount, Tickets Count, Cost)(If your data columns have different names, either rename them in your model or update the first two lines of thetransformblock).
- Second, copy the JSON specification: Grab the complete JSON code provided at the bottom of this article.
- Third, paste into your visual container: Drop the code into your Power BI Deneb visual or any Vega-Lite 5 renderer and watch it automatically rank, calculate cumulative percentages, and flag the 80% threshold!
🎨 How to Customize the Parameters
You don’t need to be a Vega-Lite expert to tweak this chart. Here are the two most common adjustments:
1. 🌈 Changing the Bar & Accent Colors
To change the primary bar color (items within the top 80%) and the muted bar color (items outside the 80%), look for the "BARS" layer around line 280:
JSON
"color": {
  "field": "IsTop80",
  "type": "nominal",
  "scale": {
    "domain": [1, 0],
    "range": [
      "#2a78d6",   // 🔵 COLOR FOR TOP 80% BARS (Change this hex code)
      "#dbe3ec"    // ⚪ COLOR FOR REMAINING BARS (Change this hex code)
    ]
  },
  "legend": null
}
- To change the orange milestone highlight (the ring on the 80% cutoff point), change
#eb6834in thePARETO_CROSSmark andKPI_VAL_3.
2. 📏 Controlling How Many Bars Are Displayed
By default, the chart dynamically limits the list to prevent overcrowding and rolls up extra categories into a summary "Other / Pozostałe" bar.
Find this calculation in the transform section (around line 43):
JSON
{
  "calculate": "datum.TotalCategories <= 20 ? datum.TotalCategories : min(max(datum.CatsTo80, 5), 20)",
  "as": "RowsShown"
}
- To show more/fewer bars: Replace
20with your preferred maximum limit (e.g.,10or15). - To show ALL categories without rollup: Simply set:
JSON"calculate": "datum.TotalCategories", "as": "RowsShown"
3. 🌐 Language / Label Localization (Optional)
The template includes built-in KPI titles and summary labels in Polish. You can quickly replace them with English (or any other language):
- Change
"TOP KATEGORIA"➔"TOP CATEGORY"(inKPI_TITLE_1) - Change
"UDZIAŁ TOP 1"➔"TOP 1 SHARE"(inKPI_TITLE_2) - Change
"KATEGORIE DO 80%"➔"CATS TO 80%"(inKPI_TITLE_3) - Change
"WARTOŚĆ ŁĄCZNIE"➔"TOTAL VALUE"(inKPI_TITLE_4) - Change
"Pozostałe"➔"Other"(inIsOtherlabel transform)
💻 Full Ready-to-Use Vega-Lite JSON Code
JSON
{
"$schema": "https://vega.github.io/schema/vega-lite/v5.json",
"data": {
"name": "dataset"
},
"transform": [
{
"calculate": "datum['Category']",
"as": "_cat"
},
{
"calculate": "toNumber(datum['Value'])",
"as": "_val"
},
{
"filter": "isValid(datum._cat) && isValid(datum._val) && datum._val > 0"
},
{
"aggregate": [
{
"op": "sum",
"field": "_val",
"as": "_val"
}
],
"groupby": [
"_cat"
]
},
{
"joinaggregate": [
{
"op": "sum",
"field": "_val",
"as": "TotalValue"
},
{
"op": "count",
"field": "_cat",
"as": "TotalCategories"
}
]
},
{
"calculate": "datum._val / datum.TotalValue",
"as": "Share0"
},
{
"window": [
{
"op": "row_number",
"as": "Rank0"
},
{
"op": "sum",
"field": "Share0",
"as": "CumShare0"
}
],
"sort": [
{
"field": "_val",
"order": "descending"
}
]
},
{
"calculate": "datum.CumShare0 - datum.Share0",
"as": "Prev0"
},
{
"calculate": "datum.Prev0 < 0.8 ? 1 : 0",
"as": "Top80_0"
},
{
"joinaggregate": [
{
"op": "sum",
"field": "Top80_0",
"as": "CatsTo80"
}
]
},
{
"calculate": "datum.TotalCategories <= 20 ? datum.TotalCategories : min(max(datum.CatsTo80, 5), 20)",
"as": "RowsShown"
},
{
"calculate": "datum.Rank0 <= datum.RowsShown ? 0 : 1",
"as": "IsOther"
},
{
"calculate": "datum.IsOther === 1 ? 'Pozostałe (' + (datum.TotalCategories - datum.RowsShown) + ')' : datum._cat",
"as": "_disp"
},
{
"aggregate": [
{
"op": "sum",
"field": "_val",
"as": "_val"
},
{
"op": "max",
"field": "CumShare0",
"as": "CumShare"
},
{
"op": "min",
"field": "Rank0",
"as": "Rank"
},
{
"op": "max",
"field": "Top80_0",
"as": "_t80"
},
{
"op": "max",
"field": "IsOther",
"as": "IsOther"
}
],
"groupby": [
"_disp",
"TotalValue",
"TotalCategories",
"CatsTo80",
"RowsShown"
]
},
{
"calculate": "datum.IsOther === 1 ? 0 : datum._t80",
"as": "IsTop80"
},
{
"calculate": "datum._val / datum.TotalValue",
"as": "Share"
},
{
"joinaggregate": [
{
"op": "max",
"field": "Share",
"as": "MaxShare"
}
]
},
{
"calculate": "datum.Share / datum.MaxShare * 0.44",
"as": "BarX"
},
{
"calculate": "0.58",
"as": "CumBase"
},
{
"calculate": "0.58 + datum.CumShare * 0.36",
"as": "CumX"
},
{
"calculate": "datum.IsTop80 === 1 ? datum.Rank : 0",
"as": "_t80rank"
},
{
"joinaggregate": [
{
"op": "max",
"field": "_t80rank",
"as": "LastTop80"
}
]
},
{
"calculate": "datum.CatsTo80 + ' z ' + datum.TotalCategories",
"as": "TopNLabel"
},
{
"calculate": "length(datum._disp) <= 20 ? -1 : lastindexof(slice(datum._disp, 0, 21), ' ')",
"as": "_wrapAt"
},
{
"calculate": "datum._wrapAt < 1 ? datum._disp : slice(datum._disp, 0, datum._wrapAt) + '|' + slice(datum._disp, datum._wrapAt + 1)",
"as": "_dispWrap"
}
],
"encoding": {
"y": {
"field": "_disp",
"type": "nominal",
"sort": {
"op": "min",
"field": "Rank",
"order": "ascending"
},
"axis": {
"title": null,
"ticks": false,
"domain": false,
"labelFontSize": 12,
"labelFontWeight": 600,
"labelColor": "#334155",
"labelPadding": 28,
"labelLimit": 220
}
}
},
"layer": [
{
"name": "KPI_TITLE_1",
"transform": [
{
"filter": "datum.Rank === 1"
}
],
"mark": {
"type": "text",
"align": "left",
"baseline": "bottom",
"dy": -76,
"fontSize": 9,
"fontWeight": "bold",
"fill": "#94a3b8",
"text": "TOP KATEGORIA"
},
"encoding": {
"x": {
"datum": 0,
"type": "quantitative",
"scale": {
"domain": [
0,
1.06
]
},
"axis": null
}
}
},
{
"name": "KPI_VAL_1",
"transform": [
{
"filter": "datum.Rank === 1"
}
],
"mark": {
"type": "text",
"align": "left",
"baseline": "top",
"dy": -72,
"fontSize": 15,
"fontWeight": "normal",
"fill": "#2a78d6",
"limit": 180,
"lineBreak": "|",
"lineHeight": 18
},
"encoding": {
"x": {
"datum": 0,
"type": "quantitative",
"axis": null
},
"text": {
"field": "_dispWrap",
"type": "nominal"
}
}
},
{
"name": "KPI_TITLE_2",
"transform": [
{
"filter": "datum.Rank === 1"
}
],
"mark": {
"type": "text",
"align": "left",
"baseline": "bottom",
"dy": -76,
"fontSize": 9,
"fontWeight": "bold",
"fill": "#94a3b8",
"text": "UDZIAŁ TOP 1"
},
"encoding": {
"x": {
"datum": 0.42,
"type": "quantitative",
"axis": null
}
}
},
{
"name": "KPI_VAL_2",
"transform": [
{
"filter": "datum.Rank === 1"
}
],
"mark": {
"type": "text",
"align": "left",
"baseline": "top",
"dy": -72,
"fontSize": 15,
"fontWeight": "bold",
"fill": "#0f172a"
},
"encoding": {
"x": {
"datum": 0.42,
"type": "quantitative",
"axis": null
},
"text": {
"field": "Share",
"type": "quantitative",
"format": ".1%"
}
}
},
{
"name": "KPI_TITLE_3",
"transform": [
{
"filter": "datum.Rank === 1"
}
],
"mark": {
"type": "text",
"align": "left",
"baseline": "bottom",
"dy": -76,
"fontSize": 9,
"fontWeight": "bold",
"fill": "#94a3b8",
"text": "KATEGORIE DO 80%"
},
"encoding": {
"x": {
"datum": 0.63,
"type": "quantitative",
"axis": null
}
}
},
{
"name": "KPI_VAL_3",
"transform": [
{
"filter": "datum.Rank === 1"
}
],
"mark": {
"type": "text",
"align": "left",
"baseline": "top",
"dy": -72,
"fontSize": 15,
"fontWeight": "bold",
"fill": "#eb6834"
},
"encoding": {
"x": {
"datum": 0.63,
"type": "quantitative",
"axis": null
},
"text": {
"field": "TopNLabel",
"type": "nominal"
}
}
},
{
"name": "KPI_TITLE_4",
"transform": [
{
"filter": "datum.Rank === 1"
}
],
"mark": {
"type": "text",
"align": "right",
"baseline": "bottom",
"dy": -76,
"fontSize": 9,
"fontWeight": "bold",
"fill": "#94a3b8",
"text": "WARTOŚĆ ŁĄCZNIE"
},
"encoding": {
"x": {
"datum": 1.06,
"type": "quantitative",
"axis": null
}
}
},
{
"name": "KPI_VAL_4",
"transform": [
{
"filter": "datum.Rank === 1"
}
],
"mark": {
"type": "text",
"align": "right",
"baseline": "top",
"dy": -72,
"fontSize": 15,
"fontWeight": "bold",
"fill": "#475569"
},
"encoding": {
"x": {
"datum": 1.06,
"type": "quantitative",
"axis": null
},
"text": {
"field": "TotalValue",
"type": "quantitative",
"format": ",.0f"
}
}
},
{
"name": "ZONE_TITLE_BARS",
"transform": [
{
"filter": "datum.Rank === 1"
}
],
"mark": {
"type": "text",
"align": "left",
"baseline": "bottom",
"dy": -14,
"fontSize": 9,
"fontWeight": "bold",
"fill": "#b4bfcc",
"text": "UDZIAŁ"
},
"encoding": {
"x": {
"datum": 0,
"type": "quantitative",
"axis": null
}
}
},
{
"name": "ZONE_TITLE_CUM",
"transform": [
{
"filter": "datum.Rank === 1"
}
],
"mark": {
"type": "text",
"align": "left",
"baseline": "bottom",
"dy": -14,
"fontSize": 9,
"fontWeight": "bold",
"fill": "#b4bfcc",
"text": "NARASTAJĄCO"
},
"encoding": {
"x": {
"datum": 0.58,
"type": "quantitative",
"axis": null
}
}
},
{
"name": "RAIL",
"mark": {
"type": "bar",
"height": {
"band": 0.6
},
"cornerRadius": 7,
"fill": "#f1f5f9"
},
"encoding": {
"x": {
"datum": 0,
"type": "quantitative",
"axis": null
},
"x2": {
"datum": 0.44
}
}
},
{
"name": "BARS",
"mark": {
"type": "bar",
"cornerRadiusEnd": 7,
"height": {
"band": 0.6
},
"cursor": "pointer"
},
"encoding": {
"x": {
"field": "BarX",
"type": "quantitative",
"axis": null
},
"color": {
"field": "IsTop80",
"type": "nominal",
"scale": {
"domain": [
1,
0
],
"range": [
"#2a78d6",
"#dbe3ec"
]
},
"legend": null
},
"opacity": {
"condition": {
"test": "isValid(datum.__selected__) && datum.__selected__ === 'off'",
"value": 0.3
},
"value": 1
},
"tooltip": [
{
"field": "_disp",
"type": "nominal",
"title": "Kategoria"
},
{
"field": "_val",
"type": "quantitative",
"title": "Wartość",
"format": ",.0f"
},
{
"field": "Share",
"type": "quantitative",
"title": "Udział",
"format": ".1%"
},
{
"field": "CumShare",
"type": "quantitative",
"title": "Narastająco",
"format": ".1%"
},
{
"field": "Rank",
"type": "quantitative",
"title": "Pozycja"
}
]
}
},
{
"name": "RANK_GUTTER",
"transform": [
{
"filter": "datum.IsOther === 0"
}
],
"mark": {
"type": "text",
"align": "right",
"baseline": "middle",
"dx": -10,
"fontSize": 10,
"fontWeight": "bold"
},
"encoding": {
"x": {
"datum": 0,
"type": "quantitative",
"axis": null
},
"text": {
"field": "Rank",
"type": "quantitative"
},
"color": {
"condition": {
"test": "datum.IsTop80 === 1",
"value": "#94a3b8"
},
"value": "#cbd5e1"
}
}
},
{
"name": "BAR_LABELS",
"mark": {
"type": "text",
"align": "left",
"dx": 9,
"baseline": "middle",
"fontSize": 11,
"fontWeight": "bold"
},
"encoding": {
"x": {
"field": "BarX",
"type": "quantitative",
"axis": null
},
"text": {
"field": "Share",
"type": "quantitative",
"format": ".1%"
},
"color": {
"condition": {
"test": "datum.IsTop80 === 1",
"value": "#0f172a"
},
"value": "#64748b"
}
}
},
{
"name": "PARETO_80_LINE",
"mark": {
"type": "rule",
"strokeDash": [
3,
4
],
"color": "#cbd5e1",
"strokeWidth": 1.5
},
"encoding": {
"x": {
"datum": 0.868,
"type": "quantitative",
"axis": null
},
"y": null
}
},
{
"name": "PARETO_80_LABEL",
"transform": [
{
"filter": "datum.Rank === 1"
}
],
"mark": {
"type": "text",
"align": "center",
"baseline": "bottom",
"dy": -14,
"fontSize": 9,
"fontWeight": "bold",
"fill": "#94a3b8",
"text": "80%"
},
"encoding": {
"x": {
"datum": 0.868,
"type": "quantitative",
"axis": null
}
}
},
{
"name": "CUM_STEMS",
"mark": {
"type": "rule",
"stroke": "#dce8f6",
"strokeWidth": 5,
"strokeCap": "round"
},
"encoding": {
"x": {
"field": "CumBase",
"type": "quantitative",
"axis": null
},
"x2": {
"field": "CumX"
}
}
},
{
"name": "PARETO_LINE",
"mark": {
"type": "line",
"color": "#1e293b",
"strokeWidth": 2,
"interpolate": "monotone"
},
"encoding": {
"x": {
"field": "CumX",
"type": "quantitative",
"axis": null
},
"order": {
"field": "Rank",
"type": "quantitative"
}
}
},
{
"name": "PARETO_CROSS",
"transform": [
{
"filter": "datum.CatsTo80 <= datum.RowsShown && datum.Rank === datum.LastTop80"
}
],
"mark": {
"type": "point",
"size": 190,
"fill": null,
"stroke": "#eb6834",
"strokeWidth": 2
},
"encoding": {
"x": {
"field": "CumX",
"type": "quantitative",
"axis": null
}
}
},
{
"name": "PARETO_POINTS",
"mark": {
"type": "point",
"filled": true,
"size": 70,
"stroke": "#ffffff",
"strokeWidth": 2,
"cursor": "pointer"
},
"encoding": {
"x": {
"field": "CumX",
"type": "quantitative",
"axis": null
},
"color": {
"condition": {
"test": "datum.IsTop80 === 1",
"value": "#1e293b"
},
"value": "#94a3b8"
},
"opacity": {
"condition": {
"test": "isValid(datum.__selected__) && datum.__selected__ === 'off'",
"value": 0.3
},
"value": 1
},
"tooltip": [
{
"field": "_disp",
"type": "nominal",
"title": "Kategoria"
},
{
"field": "CumShare",
"type": "quantitative",
"title": "Narastająco",
"format": ".1%"
},
{
"field": "Share",
"type": "quantitative",
"title": "Udział",
"format": ".1%"
}
]
}
},
{
"name": "CUM_LABELS",
"mark": {
"type": "text",
"align": "left",
"baseline": "middle",
"dx": 6,
"fontSize": 11,
"fontWeight": "bold"
},
"encoding": {
"x": {
"datum": 0.955,
"type": "quantitative",
"axis": null
},
"text": {
"field": "CumShare",
"type": "quantitative",
"format": ".0%"
},
"color": {
"condition": {
"test": "datum.IsTop80 === 1",
"value": "#0f172a"
},
"value": "#94a3b8"
}
}
}
],
"config": {
"view": {
"stroke": "transparent"
},
"font": "Segoe UI, -apple-system, BlinkMacSystemFont, Roboto, sans-serif",
"padding": {
"top": 92,
"left": 12,
"right": 30,
"bottom": 12
}
}
}
🚀 Final Thoughts
With this Vega-Lite Pareto chart template, you get a modern, executive-ready dashboard component without writing hundreds of lines of calculations from scratch.
Have you tried using this template with your own data? Drop a comment below with your use case or any color combinations you've customized! 💬👇
Ready to eliminate static sorting bugs and elevate your dashboard design? You can grab the complete, copy-paste-ready Vega-Lite JSON specification and drop it straight into your Deneb visual.
📥 Download the Vega-Lite JSON Code (click below link)
Feel free to adapt the colors, label thresholds, and category counts to fit your organization's design system!