
Szukasz nowoczesnego, gotowego do wdrożenia szablonu wykresu Pareto w Vega-Lite, który wyniesie Twoje dashboardy w Power BI (Deneb) lub aplikacjach webowych na wyższy poziom? Trafiłeś w idealne miejsce!
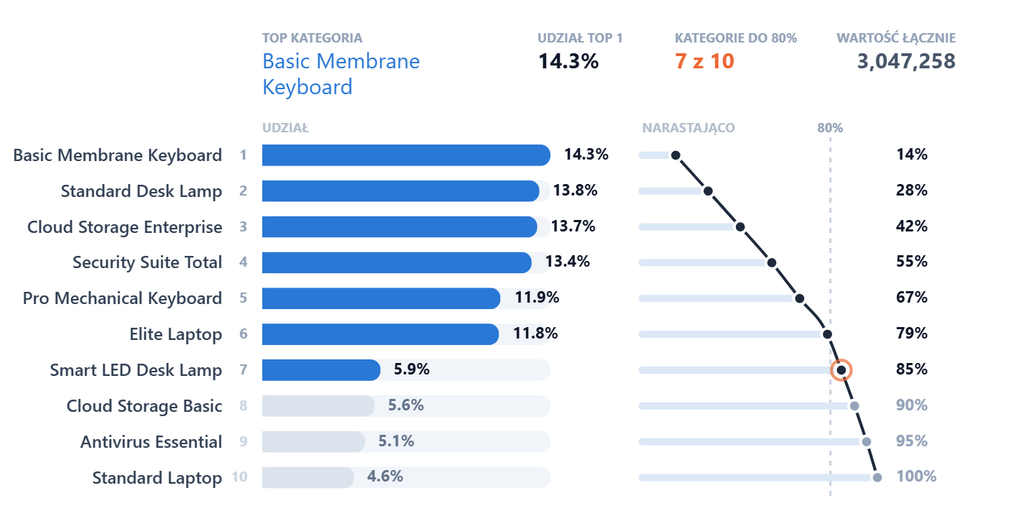
Wykres Pareto opiera się na słynnej zasadzie 80/20 (zasadzie Pareto): około 80% skutków wynika z 20% przyczyn. Ta niestandardowa wizualizacja łączy karty podsumowujące KPI, poziome słupki rozkładu oraz krzywą udziału skumulowanego w jeden spójny, efektowny projekt.
SPIS Treści:
🎯 Kiedy warto używać wykresu Pareto? (Główne zastosowania)
Wykres Pareto w Vega-Lite sprawdza się idealnie zawsze wtedy, gdy musisz oddzielić „kluczowe nieliczne” od „błahych licznych” czynników (vital few vs. trivial many):
-
💰 Sprzedaż i przychody (analiza ABC): Zidentyfikuj 20% produktów lub klientów, którzy generują 80% Twoich całkowitych przychodów.
-
🐛 Priorytetyzacja błędów i zgłoszeń serwisowych: Odkryj, które powtarzające się błędy w oprogramowaniu odpowiadają za zdecydowaną większość skarg użytkowników.
-
📦 Łańcuch dostaw i stany magazynowe: Wskaż najbardziej kosztowne pozycje magazynowe pochłaniające lwią część Twojego budżetu.
-
👥 Marketing i ruch na stronie: Wyodrębnij kilka najskuteczniejszych stron docelowych lub kampanii, które generują większość pozyskiwanych leadów.
🛠️ Jak wdrożyć ten szablon (3 szybkie kroki)
💡 Wskazówka – uniwersalny kod: Ten szablon JSON działa w 100% w formule plug-and-play. Współpracuje z dowolnym zbiorem danych — potrzebujesz jedynie dwóch pól: kolumny tekstowej/kategorii oraz kolumny z wartością liczbową.
Wykonaj poniższe kroki, aby wdrożyć ten wykres Pareto w Vega-Lite do swojego projektu:
-
Po pierwsze, przygotuj pola danych: Upewnij się, że Twój zbiór danych w wizualizacji zawiera dwie kolumny:
-
Category (np. Nazwa produktu, Kraj, Typ zgłoszenia)
-
Value (np. Wielkość sprzedaży, Liczba zgłoszeń, Koszt)
(Jeśli Twoje kolumny nazywają się inaczej, zmień ich nazwy w modelu lub zaktualizuj dwa pierwsze wiersze w sekcji transformacjitransform).
-
-
Po drugie, skopiuj specyfikację JSON: Pobierz kompletny kod JSON umieszczony na dole tego artykułu.
-
Po trzecie, wklej kod do kontenera wizualizacji: Wklej kod do wizualizacji Deneb w Power BI (lub dowolnego silnika renderującego Vega-Lite 5) i zobacz, jak wykres automatycznie tworzy ranking, oblicza skumulowane wartości procentowe oraz wyznacza próg 80%!
🎨 Jak dostosować parametry
Nie musisz być ekspertem od Vega-Lite, aby dostosować ten wykres do własnych potrzeb. Oto dwie najczęstsze modyfikacje:
1. 🌈 Zmiana kolorów słupków i akcentów
Aby zmienić podstawowy kolor słupków (elementy mieszczące się w górnych 80%) oraz stonowany kolor pozostałych słupków (elementy powyżej progu 80%), odszukaj warstwę
"BARS" w okolicach wiersza 280:JSON
"color": {
  "field": "IsTop80",
  "type": "nominal",
  "scale": {
    "domain": [1, 0],
    "range": [
      "#2a78d6",   // 🔵 COLOR FOR TOP 80% BARS (Change this hex code)
      "#dbe3ec"    // ⚪ COLOR FOR REMAINING BARS (Change this hex code)
    ]
  },
  "legend": null
}
-
Aby zmienić pomarańczowe wyróżnienie punktu kontrolnego (okrąg wyznaczający próg 80%), zmień kod
#eb6834w znacznikuPARETO_CROSSoraz w sekcjiKPI_VAL_3.
2. 📏 Sterowanie liczbą wyświetlanych słupków
Domyślnie wykres dynamicznie ogranicza liczbę pozycji, aby uniknąć przeładowania wizualizacji, a nadmiarowe kategorie łączy w zbiorczy słupek podsumowujący „Other / Pozostałe”.
Znajdź to obliczenie w sekcji
transform (w okolicach wiersza 43):JSON
{
  "calculate": "datum.TotalCategories <= 20 ? datum.TotalCategories : min(max(datum.CatsTo80, 5), 20)",
  "as": "RowsShown"
}
-
-
Aby pokazać więcej/mniej słupków: Zamień wartość
20na preferowany limit maksymalny (np.10lub15). -
Aby pokazać WSZYSTKIE kategorie bez zwijania do podsumowania: Po prostu ustaw:
"calculate": "datum.TotalCategories", "as": "RowsShown"
-
3. 🌐 Lokalizacja języka i etykiet
Szablon zawiera wbudowane tytuły wskaźników KPI oraz etykiety podsumowań w języku polskim. Możesz je szybko zastąpić wersją angielską (lub dowolnym innym językiem):
- Zmień
"TOP KATEGORIA"➔"TOP CATEGORY"(wKPI_TITLE_1) - Zmień
"UDZIAŁ TOP 1"➔"TOP 1 SHARE"(wKPI_TITLE_2) - Zmień
"KATEGORIE DO 80%"➔"CATS TO 80%"(wKPI_TITLE_3) - Zmień
"WARTOŚĆ ŁĄCZNIE"➔"TOTAL VALUE"(wKPI_TITLE_4) - Zmień
"Pozostałe"➔"Other"(wIsOtherlabel transform)
💻 Pełny, gotowy do użycia kod JSON w Vega-Lite
JSON
{
"$schema": "https://vega.github.io/schema/vega-lite/v5.json",
"data": {
"name": "dataset"
},
"transform": [
{
"calculate": "datum['Category']",
"as": "_cat"
},
{
"calculate": "toNumber(datum['Value'])",
"as": "_val"
},
{
"filter": "isValid(datum._cat) && isValid(datum._val) && datum._val > 0"
},
{
"aggregate": [
{
"op": "sum",
"field": "_val",
"as": "_val"
}
],
"groupby": [
"_cat"
]
},
{
"joinaggregate": [
{
"op": "sum",
"field": "_val",
"as": "TotalValue"
},
{
"op": "count",
"field": "_cat",
"as": "TotalCategories"
}
]
},
{
"calculate": "datum._val / datum.TotalValue",
"as": "Share0"
},
{
"window": [
{
"op": "row_number",
"as": "Rank0"
},
{
"op": "sum",
"field": "Share0",
"as": "CumShare0"
}
],
"sort": [
{
"field": "_val",
"order": "descending"
}
]
},
{
"calculate": "datum.CumShare0 - datum.Share0",
"as": "Prev0"
},
{
"calculate": "datum.Prev0 < 0.8 ? 1 : 0",
"as": "Top80_0"
},
{
"joinaggregate": [
{
"op": "sum",
"field": "Top80_0",
"as": "CatsTo80"
}
]
},
{
"calculate": "datum.TotalCategories <= 20 ? datum.TotalCategories : min(max(datum.CatsTo80, 5), 20)",
"as": "RowsShown"
},
{
"calculate": "datum.Rank0 <= datum.RowsShown ? 0 : 1",
"as": "IsOther"
},
{
"calculate": "datum.IsOther === 1 ? 'Pozostałe (' + (datum.TotalCategories - datum.RowsShown) + ')' : datum._cat",
"as": "_disp"
},
{
"aggregate": [
{
"op": "sum",
"field": "_val",
"as": "_val"
},
{
"op": "max",
"field": "CumShare0",
"as": "CumShare"
},
{
"op": "min",
"field": "Rank0",
"as": "Rank"
},
{
"op": "max",
"field": "Top80_0",
"as": "_t80"
},
{
"op": "max",
"field": "IsOther",
"as": "IsOther"
}
],
"groupby": [
"_disp",
"TotalValue",
"TotalCategories",
"CatsTo80",
"RowsShown"
]
},
{
"calculate": "datum.IsOther === 1 ? 0 : datum._t80",
"as": "IsTop80"
},
{
"calculate": "datum._val / datum.TotalValue",
"as": "Share"
},
{
"joinaggregate": [
{
"op": "max",
"field": "Share",
"as": "MaxShare"
}
]
},
{
"calculate": "datum.Share / datum.MaxShare * 0.44",
"as": "BarX"
},
{
"calculate": "0.58",
"as": "CumBase"
},
{
"calculate": "0.58 + datum.CumShare * 0.36",
"as": "CumX"
},
{
"calculate": "datum.IsTop80 === 1 ? datum.Rank : 0",
"as": "_t80rank"
},
{
"joinaggregate": [
{
"op": "max",
"field": "_t80rank",
"as": "LastTop80"
}
]
},
{
"calculate": "datum.CatsTo80 + ' z ' + datum.TotalCategories",
"as": "TopNLabel"
},
{
"calculate": "length(datum._disp) <= 20 ? -1 : lastindexof(slice(datum._disp, 0, 21), ' ')",
"as": "_wrapAt"
},
{
"calculate": "datum._wrapAt < 1 ? datum._disp : slice(datum._disp, 0, datum._wrapAt) + '|' + slice(datum._disp, datum._wrapAt + 1)",
"as": "_dispWrap"
}
],
"encoding": {
"y": {
"field": "_disp",
"type": "nominal",
"sort": {
"op": "min",
"field": "Rank",
"order": "ascending"
},
"axis": {
"title": null,
"ticks": false,
"domain": false,
"labelFontSize": 12,
"labelFontWeight": 600,
"labelColor": "#334155",
"labelPadding": 28,
"labelLimit": 220
}
}
},
"layer": [
{
"name": "KPI_TITLE_1",
"transform": [
{
"filter": "datum.Rank === 1"
}
],
"mark": {
"type": "text",
"align": "left",
"baseline": "bottom",
"dy": -76,
"fontSize": 9,
"fontWeight": "bold",
"fill": "#94a3b8",
"text": "TOP KATEGORIA"
},
"encoding": {
"x": {
"datum": 0,
"type": "quantitative",
"scale": {
"domain": [
0,
1.06
]
},
"axis": null
}
}
},
{
"name": "KPI_VAL_1",
"transform": [
{
"filter": "datum.Rank === 1"
}
],
"mark": {
"type": "text",
"align": "left",
"baseline": "top",
"dy": -72,
"fontSize": 15,
"fontWeight": "normal",
"fill": "#2a78d6",
"limit": 180,
"lineBreak": "|",
"lineHeight": 18
},
"encoding": {
"x": {
"datum": 0,
"type": "quantitative",
"axis": null
},
"text": {
"field": "_dispWrap",
"type": "nominal"
}
}
},
{
"name": "KPI_TITLE_2",
"transform": [
{
"filter": "datum.Rank === 1"
}
],
"mark": {
"type": "text",
"align": "left",
"baseline": "bottom",
"dy": -76,
"fontSize": 9,
"fontWeight": "bold",
"fill": "#94a3b8",
"text": "UDZIAŁ TOP 1"
},
"encoding": {
"x": {
"datum": 0.42,
"type": "quantitative",
"axis": null
}
}
},
{
"name": "KPI_VAL_2",
"transform": [
{
"filter": "datum.Rank === 1"
}
],
"mark": {
"type": "text",
"align": "left",
"baseline": "top",
"dy": -72,
"fontSize": 15,
"fontWeight": "bold",
"fill": "#0f172a"
},
"encoding": {
"x": {
"datum": 0.42,
"type": "quantitative",
"axis": null
},
"text": {
"field": "Share",
"type": "quantitative",
"format": ".1%"
}
}
},
{
"name": "KPI_TITLE_3",
"transform": [
{
"filter": "datum.Rank === 1"
}
],
"mark": {
"type": "text",
"align": "left",
"baseline": "bottom",
"dy": -76,
"fontSize": 9,
"fontWeight": "bold",
"fill": "#94a3b8",
"text": "KATEGORIE DO 80%"
},
"encoding": {
"x": {
"datum": 0.63,
"type": "quantitative",
"axis": null
}
}
},
{
"name": "KPI_VAL_3",
"transform": [
{
"filter": "datum.Rank === 1"
}
],
"mark": {
"type": "text",
"align": "left",
"baseline": "top",
"dy": -72,
"fontSize": 15,
"fontWeight": "bold",
"fill": "#eb6834"
},
"encoding": {
"x": {
"datum": 0.63,
"type": "quantitative",
"axis": null
},
"text": {
"field": "TopNLabel",
"type": "nominal"
}
}
},
{
"name": "KPI_TITLE_4",
"transform": [
{
"filter": "datum.Rank === 1"
}
],
"mark": {
"type": "text",
"align": "right",
"baseline": "bottom",
"dy": -76,
"fontSize": 9,
"fontWeight": "bold",
"fill": "#94a3b8",
"text": "WARTOŚĆ ŁĄCZNIE"
},
"encoding": {
"x": {
"datum": 1.06,
"type": "quantitative",
"axis": null
}
}
},
{
"name": "KPI_VAL_4",
"transform": [
{
"filter": "datum.Rank === 1"
}
],
"mark": {
"type": "text",
"align": "right",
"baseline": "top",
"dy": -72,
"fontSize": 15,
"fontWeight": "bold",
"fill": "#475569"
},
"encoding": {
"x": {
"datum": 1.06,
"type": "quantitative",
"axis": null
},
"text": {
"field": "TotalValue",
"type": "quantitative",
"format": ",.0f"
}
}
},
{
"name": "ZONE_TITLE_BARS",
"transform": [
{
"filter": "datum.Rank === 1"
}
],
"mark": {
"type": "text",
"align": "left",
"baseline": "bottom",
"dy": -14,
"fontSize": 9,
"fontWeight": "bold",
"fill": "#b4bfcc",
"text": "UDZIAŁ"
},
"encoding": {
"x": {
"datum": 0,
"type": "quantitative",
"axis": null
}
}
},
{
"name": "ZONE_TITLE_CUM",
"transform": [
{
"filter": "datum.Rank === 1"
}
],
"mark": {
"type": "text",
"align": "left",
"baseline": "bottom",
"dy": -14,
"fontSize": 9,
"fontWeight": "bold",
"fill": "#b4bfcc",
"text": "NARASTAJĄCO"
},
"encoding": {
"x": {
"datum": 0.58,
"type": "quantitative",
"axis": null
}
}
},
{
"name": "RAIL",
"mark": {
"type": "bar",
"height": {
"band": 0.6
},
"cornerRadius": 7,
"fill": "#f1f5f9"
},
"encoding": {
"x": {
"datum": 0,
"type": "quantitative",
"axis": null
},
"x2": {
"datum": 0.44
}
}
},
{
"name": "BARS",
"mark": {
"type": "bar",
"cornerRadiusEnd": 7,
"height": {
"band": 0.6
},
"cursor": "pointer"
},
"encoding": {
"x": {
"field": "BarX",
"type": "quantitative",
"axis": null
},
"color": {
"field": "IsTop80",
"type": "nominal",
"scale": {
"domain": [
1,
0
],
"range": [
"#2a78d6",
"#dbe3ec"
]
},
"legend": null
},
"opacity": {
"condition": {
"test": "isValid(datum.__selected__) && datum.__selected__ === 'off'",
"value": 0.3
},
"value": 1
},
"tooltip": [
{
"field": "_disp",
"type": "nominal",
"title": "Kategoria"
},
{
"field": "_val",
"type": "quantitative",
"title": "Wartość",
"format": ",.0f"
},
{
"field": "Share",
"type": "quantitative",
"title": "Udział",
"format": ".1%"
},
{
"field": "CumShare",
"type": "quantitative",
"title": "Narastająco",
"format": ".1%"
},
{
"field": "Rank",
"type": "quantitative",
"title": "Pozycja"
}
]
}
},
{
"name": "RANK_GUTTER",
"transform": [
{
"filter": "datum.IsOther === 0"
}
],
"mark": {
"type": "text",
"align": "right",
"baseline": "middle",
"dx": -10,
"fontSize": 10,
"fontWeight": "bold"
},
"encoding": {
"x": {
"datum": 0,
"type": "quantitative",
"axis": null
},
"text": {
"field": "Rank",
"type": "quantitative"
},
"color": {
"condition": {
"test": "datum.IsTop80 === 1",
"value": "#94a3b8"
},
"value": "#cbd5e1"
}
}
},
{
"name": "BAR_LABELS",
"mark": {
"type": "text",
"align": "left",
"dx": 9,
"baseline": "middle",
"fontSize": 11,
"fontWeight": "bold"
},
"encoding": {
"x": {
"field": "BarX",
"type": "quantitative",
"axis": null
},
"text": {
"field": "Share",
"type": "quantitative",
"format": ".1%"
},
"color": {
"condition": {
"test": "datum.IsTop80 === 1",
"value": "#0f172a"
},
"value": "#64748b"
}
}
},
{
"name": "PARETO_80_LINE",
"mark": {
"type": "rule",
"strokeDash": [
3,
4
],
"color": "#cbd5e1",
"strokeWidth": 1.5
},
"encoding": {
"x": {
"datum": 0.868,
"type": "quantitative",
"axis": null
},
"y": null
}
},
{
"name": "PARETO_80_LABEL",
"transform": [
{
"filter": "datum.Rank === 1"
}
],
"mark": {
"type": "text",
"align": "center",
"baseline": "bottom",
"dy": -14,
"fontSize": 9,
"fontWeight": "bold",
"fill": "#94a3b8",
"text": "80%"
},
"encoding": {
"x": {
"datum": 0.868,
"type": "quantitative",
"axis": null
}
}
},
{
"name": "CUM_STEMS",
"mark": {
"type": "rule",
"stroke": "#dce8f6",
"strokeWidth": 5,
"strokeCap": "round"
},
"encoding": {
"x": {
"field": "CumBase",
"type": "quantitative",
"axis": null
},
"x2": {
"field": "CumX"
}
}
},
{
"name": "PARETO_LINE",
"mark": {
"type": "line",
"color": "#1e293b",
"strokeWidth": 2,
"interpolate": "monotone"
},
"encoding": {
"x": {
"field": "CumX",
"type": "quantitative",
"axis": null
},
"order": {
"field": "Rank",
"type": "quantitative"
}
}
},
{
"name": "PARETO_CROSS",
"transform": [
{
"filter": "datum.CatsTo80 <= datum.RowsShown && datum.Rank === datum.LastTop80"
}
],
"mark": {
"type": "point",
"size": 190,
"fill": null,
"stroke": "#eb6834",
"strokeWidth": 2
},
"encoding": {
"x": {
"field": "CumX",
"type": "quantitative",
"axis": null
}
}
},
{
"name": "PARETO_POINTS",
"mark": {
"type": "point",
"filled": true,
"size": 70,
"stroke": "#ffffff",
"strokeWidth": 2,
"cursor": "pointer"
},
"encoding": {
"x": {
"field": "CumX",
"type": "quantitative",
"axis": null
},
"color": {
"condition": {
"test": "datum.IsTop80 === 1",
"value": "#1e293b"
},
"value": "#94a3b8"
},
"opacity": {
"condition": {
"test": "isValid(datum.__selected__) && datum.__selected__ === 'off'",
"value": 0.3
},
"value": 1
},
"tooltip": [
{
"field": "_disp",
"type": "nominal",
"title": "Kategoria"
},
{
"field": "CumShare",
"type": "quantitative",
"title": "Narastająco",
"format": ".1%"
},
{
"field": "Share",
"type": "quantitative",
"title": "Udział",
"format": ".1%"
}
]
}
},
{
"name": "CUM_LABELS",
"mark": {
"type": "text",
"align": "left",
"baseline": "middle",
"dx": 6,
"fontSize": 11,
"fontWeight": "bold"
},
"encoding": {
"x": {
"datum": 0.955,
"type": "quantitative",
"axis": null
},
"text": {
"field": "CumShare",
"type": "quantitative",
"format": ".0%"
},
"color": {
"condition": {
"test": "datum.IsTop80 === 1",
"value": "#0f172a"
},
"value": "#94a3b8"
}
}
}
],
"config": {
"view": {
"stroke": "transparent"
},
"font": "Segoe UI, -apple-system, BlinkMacSystemFont, Roboto, sans-serif",
"padding": {
"top": 92,
"left": 12,
"right": 30,
"bottom": 12
}
}
}
🚀 Final Thoughts
Dzięki temu szablonowi wykresu Pareto w Vega-Lite zyskujesz nowoczesny, gotowy dla kadry menedżerskiej element dashboardu bez konieczności pisania setek wierszy obliczeń od zera.
Czy wypróbowałeś już ten szablon na własnych danych? Zostaw komentarz poniżej i podziel się swoim przypadkiem użycia lub zestawieniem kolorów, które udało Ci się stworzyć! 💬👇
Gotowy, by wyeliminować problemy ze statycznym sortowaniem i wznieść design swoich dashboardów na wyższy poziom? Możesz pobrać kompletną, gotową do skopiowania specyfikację Vega-Lite JSON i wkleić ją bezpośrednio do wizualizacji Deneb.
📥 Download the Vega-Lite JSON Code (click below link)
Śmiało dostosuj kolory, progi etykiet oraz liczbę kategorii do systemu projektowego (design system) swojej organizacji!