
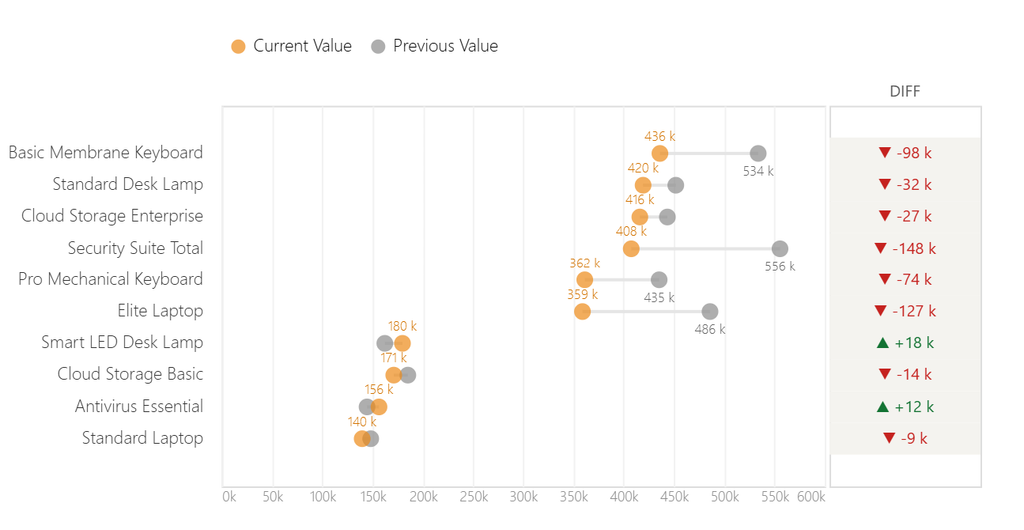
A Power BI dumbbell chart (also known as a DNA or barbell chart) is one of the cleanest visual solutions to compare two data points across categories. Native Power BI visuals often force you into cluttered grouped bar charts or separate matrix tables to show current versus prior period variances.
By leveraging Deneb and Vega-Lite, you can build a customized Power BI dumbbell chart that features automatic Top 10 ranking, collision-free data labels, human-readable number units (k and mln), and a built-in variance (DIFF) column. ✨
Why Use a Power BI Dumbbell Chart? 💡
- 🎯 Zero clutter: Displays Current Year (CY) and Previous Year (PY) on a single horizontal axis.
- 📊 Instant variance visibility: A dedicated, color-contrasted
DIFFstrip right next to the chart. - 🛡️ Smart collision prevention: When two points are too close, the prior label hides dynamically so numbers never overlap.
- 🔢 Automated number formatting: Compact values rounded to full units (
k,mln) with zero decimal noise. - 🔄 100% reusable template: Drop in any 3 fields (
Category,Current Value,Prev Value) and the visual configures itself instantly.
Step-by-Step Implementation Guide 🛠️
Step 1: Add the Deneb Visual 📦
- In Power BI Desktop, open the Visualizations pane.
- Click Get more visuals (the three dots
...). - Search for Deneb: Declarative Visualization in Power BI and click Add.
Step 2: Assign and Rename Your Fields 🏷️
- Add the Deneb visual to your report canvas.
- Drag your 3 fields into the Values field well of the visual.
- Rename the fields inside the visual bucket (right-click the field –>Rename for this visual):
- Your category column –>
Category - Your main/current metric –>
Current Value - Your comparison/prior metric –>
Prev Value
- Your category column –>
Step 3: Paste the Vega-Lite Specification 💻
- Click the
...menu on the top right of the visual and select Edit. - Replace all existing code in the specification tab with the following JSON:
JSON
 {
  "$schema": "https://vega.github.io/schema/vega-lite/v5.json",
  "data": {"name": "dataset"},
  "spacing": 1,
  "padding": {"top": 22, "left": 5, "right": 10, "bottom": 5},
  "config": {
    "font": "Segoe UI, sans-serif"
  },
  "transform": [
    {
      "filter": "datum['Category'] != null && datum['Category'] != ''"
    },
    {
      "window": [{"op": "row_number", "as": "rank"}],
      "sort": [{"field": "Current Value", "order": "descending"}]
    },
    {
      "filter": "datum.rank <= 10"
    },
    {
      "calculate": "datum['Current Value'] - datum['Prev Value']",
      "as": "Diff"
    },
    {
      "calculate": "(datum['Diff'] > 0 ? '▲ +' : datum['Diff'] < 0 ? '▼ -' : '') + (abs(datum['Diff']) >= 1000000 ? format(abs(datum['Diff']) / 1000000, ',.0f') + ' mln' : abs(datum['Diff']) >= 1000 ? format(abs(datum['Diff']) / 1000, ',.0f') + ' k' : format(abs(datum['Diff']), ',.0f'))",
      "as": "Diff_Formatted"
    },
    {
      "calculate": "abs(datum['Current Value']) >= 1000000 ? format(datum['Current Value'] / 1000000, ',.0f') + ' mln' : abs(datum['Current Value']) >= 1000 ? format(datum['Current Value'] / 1000, ',.0f') + ' k' : format(datum['Current Value'], ',.0f')",
      "as": "CY_Formatted"
    },
    {
      "calculate": "abs(datum['Prev Value']) >= 1000000 ? format(datum['Prev Value'] / 1000000, ',.0f') + ' mln' : abs(datum['Prev Value']) >= 1000 ? format(datum['Prev Value'] / 1000, ',.0f') + ' k' : format(datum['Prev Value'], ',.0f')",
      "as": "PY_Formatted_Base"
    },
    {
      "calculate": "datum['Current Value'] != 0 && abs(datum['Diff']) / abs(datum['Current Value']) < 0.15 ? '' : datum['PY_Formatted_Base']",
      "as": "PY_Formatted"
    }
  ],
  "hconcat": [
    {
      "width": 380,
      "encoding": {
        "y": {
          "field": "Category",
          "type": "nominal",
          "scale": {
            "step": 44,
            "paddingOuter": 1.0
          },
          "axis": {
            "title": null,
            "domain": false,
            "ticks": false,
            "labelPadding": 12,
            "labelFontSize": 11,
            "labelFontWeight": 300,
            "labelColor": "#333333"
          },
          "sort": {"field": "Current Value", "op": "max", "order": "descending"}
        }
      },
      "layer": [
        {
          "name": "PASEK_LACZACY",
          "mark": {
            "type": "rule",
            "color": "#E5E5E5",
            "strokeWidth": 2
          },
          "encoding": {
            "x": {
              "field": "Prev Value",
              "type": "quantitative"
            },
            "x2": {
              "field": "Current Value"
            }
          }
        },
        {
          "name": "KULKA_PY",
          "mark": {
            "type": "circle",
            "size": 110
          },
          "encoding": {
            "x": {
              "field": "Prev Value",
              "type": "quantitative",
              "axis": {
                "grid": true,
                "gridColor": "#F2F2F2",
                "domain": false,
                "ticks": false,
                "title": null,
                "labelFontSize": 9,
                "labelFontWeight": 300,
                "labelColor": "#888888",
                "format": "~s"
              }
            },
            "color": {
              "datum": "Previous Value",
              "type": "nominal",
              "scale": {
                "domain": ["Current Value", "Previous Value"],
                "range": ["#ED8A18", "#8C8C8C"]
              },
              "legend": {
                "orient": "top",
                "direction": "horizontal",
                "title": null,
                "labelFontSize": 11,
                "labelFontWeight": 300,
                "symbolSize": 80,
                "padding": 5,
                "offset": 12
              }
            }
          }
        },
        {
          "name": "ETYKIETA_PY",
          "mark": {
            "type": "text",
            "dy": 11,
            "color": "#666666",
            "fontSize": 8.5,
            "fontWeight": 300,
            "font": "Segoe UI"
          },
          "encoding": {
            "x": {"field": "Prev Value", "type": "quantitative"},
            "text": {"field": "PY_Formatted"}
          }
        },
        {
          "name": "KULKA_CY",
          "mark": {
            "type": "circle",
            "size": 110
          },
          "encoding": {
            "x": {"field": "Current Value", "type": "quantitative"},
            "color": {
              "datum": "Current Value",
              "type": "nominal"
            }
          }
        },
        {
          "name": "ETYKIETA_CY",
          "mark": {
            "type": "text",
            "dy": -11,
            "color": "#D37300",
            "fontSize": 8.5,
            "fontWeight": 300,
            "font": "Segoe UI"
          },
          "encoding": {
            "x": {"field": "Current Value", "type": "quantitative"},
            "text": {"field": "CY_Formatted"}
          }
        }
      ]
    },
    {
      "width": 95,
      "title": {
        "text": "DIFF",
        "fontSize": 10,
        "fontWeight": 400,
        "color": "#555555"
      },
      "encoding": {
        "y": {
          "field": "Category",
          "type": "nominal",
          "axis": null,
          "scale": {
            "step": 44,
            "paddingOuter": 1.0
          },
          "sort": {"field": "Current Value", "op": "max", "order": "descending"}
        }
      },
      "layer": [
        {
          "name": "TLO_DIFF",
          "mark": {
            "type": "rect",
            "color": "#F4F3EF"
          }
        },
        {
          "name": "WARTOSC_DIFF",
          "mark": {
            "type": "text",
            "fontWeight": 400,
            "fontSize": 10,
            "font": "Segoe UI"
          },
          "encoding": {
            "text": {"field": "Diff_Formatted"},
            "color": {
              "condition": [
                {
                  "test": "datum['Diff'] > 0",
                  "value": "#137333"
                },
                {
                  "test": "datum['Diff'] < 0",
                  "value": "#C5221F"
                }
              ],
              "value": "#666666"
            }
          }
        }
      ]
    }
  ],
  "resolve": {
    "scale": {
      "y": "shared"
    }
  }
}
- Press Apply (
Ctrl + Enter) and click Back to report. ✅
Customizing Your Chart ⚙️
- 🔝 Change the Top N limit: Modify
"datum.rank <= 10"inside thetransformsection (e.g., set to5or15). - 📏 Adjust row spacing: Modify
"scale": {"step": 36}to make the rows tighter or wider. - 🎨 Palette adjustments: Update the hex colors in
"range": ["#ED8A18", "#8C8C8C"]to match your corporate brand guidelines.
This custom Power BI dumbbell chart template turns routine period-over-period comparisons into executive-ready visualizations with zero maintenance. Copy the JSON, link your metrics, and elevate your dashboard design instantly. 📈🔥