

Keywords: Power Query, Power BI, M language, Power Query tips, Power BI automation, Power Query best practices, M code, data transformation, ETL Power BI.
💡 Introduction
Working efficiently in Power Query is one of the most important skills for anyone building professional Power BI reports.
Over the years, I’ve discovered several Power Query techniques in M language that save hours of work and help avoid common data-loading issues.
In this Power Shot, I’ll share 5 essential Power Query solutions that I never forget to apply in my daily Power BI projects.
Moreover, each one boosts automation, enhances flexibility, and makes your ETL process more robust and error-resistant.
👉 Click and Grab the materials from my GitHub!
Table of Contents
1️⃣ Dynamic Headers – No More Hardcoded Column Names
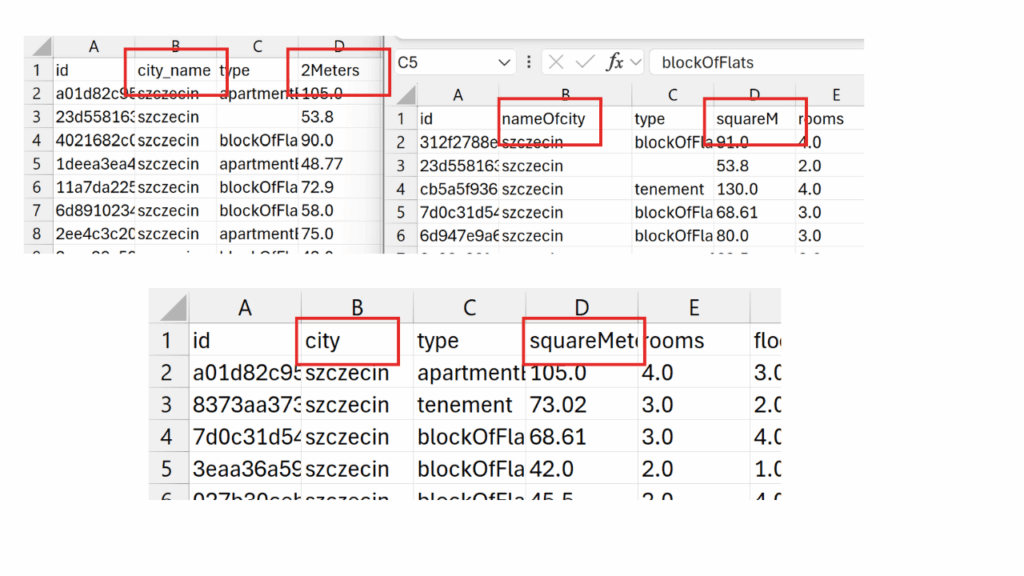
First, when you load multiple Excel or CSV files from a folder, you may face a common problem — identical structures but slightly different column names.
Instead of manually adjusting headers, you can use Dynamic Headers in M language to automatically detect and apply column names from the source file.
✅ Why it matters:
This approach eliminates the need for static headers and prevents refresh errors when column names differ slightly between files.
As a result, you avoid unnecessary manual edits and keep your data loading process fully automated.
Keyword focus: Dynamic headers Power Query, Power Query folder import, Power BI automation.
Example #1:
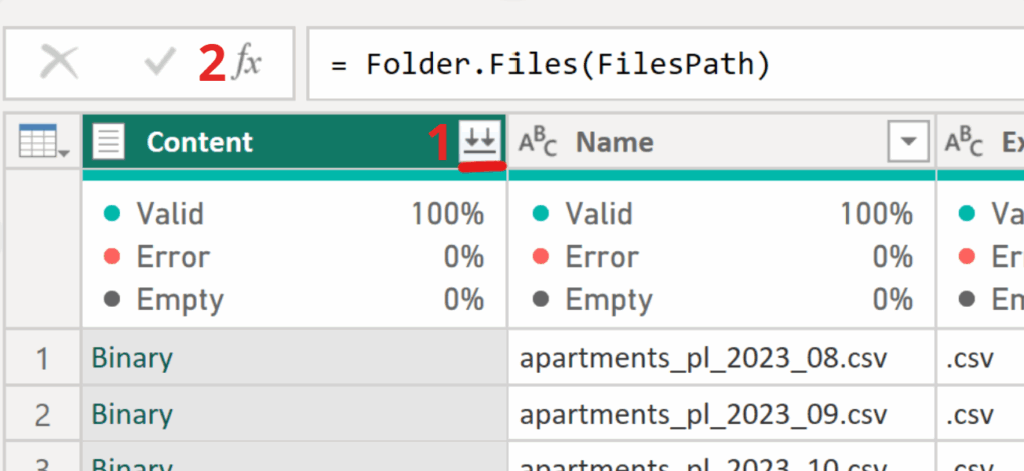
✅ First, Open Power Query and Get Data from Folder. Select the folder and click „Transform Data”.
✅ Next, instead of clicking the double arrows (1) in the Content column header, we’ll try transforming the columns by adding a new step. To do this, click the icon marked with 2.
✅ To display the full data, we’ll focus on the Content column containing the CSV files. Using Table.TransformColumns, we’ll convert the data from Binary to Table, applying Csv.Document(_) and Table.PromoteHeaders to each row. Copy below code to new step.
= Table.TransformColumns(Source, {"Content", each Table.PromoteHeaders(Csv.Document(_))})✅ Now we’ll create a list of new column names to ensure the files merge correctly, even if their headers differ. We reference the first file — TransformColumn{0}, access its Content with TransformColumn{0}[Content], and extract the column names using Table.ColumnNames().
= Table.ColumnNames(TransformColumn{0}[Content])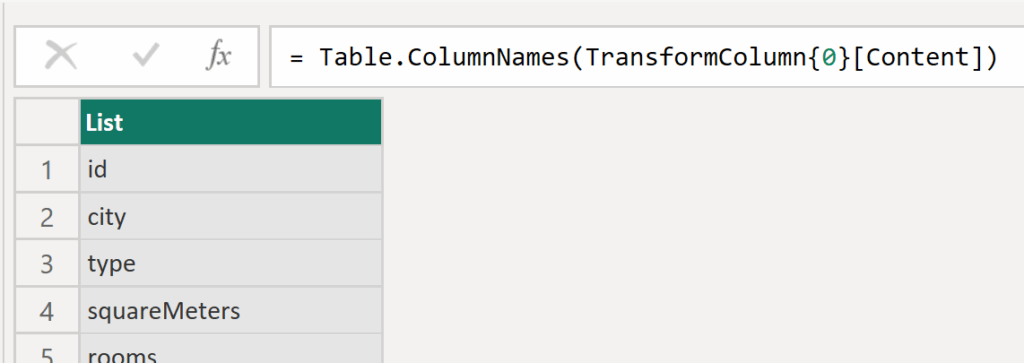
✅ To understand how renaming works, let’s walk through a simple two-column example. We use Table.RenameColumns on the result of the previous step (CombineAllFiles) and pass two nested lists: {{"id", "id_name"}, {"city", "City_name"}}—each pair maps the old column name to the new one. This makes the transformation mechanics clear.
= Table.RenameColumns(CombineAllFiles,{{"id", "id_name"}, {"city", "City_name"}})✅ Finally, we bring all transformations together. Using TransformColumns, we focus on the Content column and, for each table (_), extract column names with Table.ColumnNames(_). Then we pair them with the first file’s names using List.Zip({col_names, ColNamesFirstFile}), and rename columns with Table.RenameColumns(_, renamecolnames), where renamecolnames contains the old and new name pairs.
= Table.TransformColumns(TransformColumn, {"Content", each
let
col_names= Table.ColumnNames(_),
renamecolnames= List.Zip({col_names, ColNamesFirstFile }),
renamefile=Table.RenameColumns(_,renamecolnames)
in
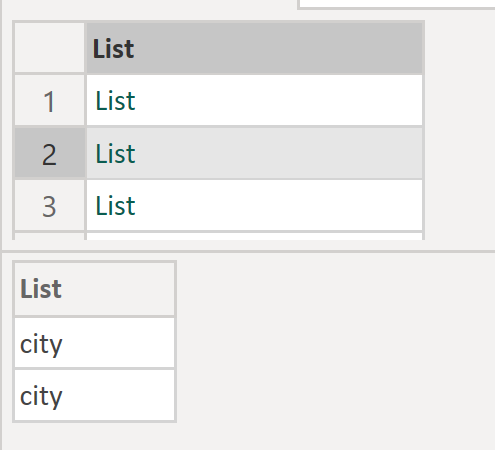
renamefile })✅ I encourage you to experiment and inspect what’s inside renamecolnames. As a quick take-home exercise, explore it—you should see a list of lists.
✅ The end goal is a clean, error-free merge of all files—even when their column names differ. The final step simply combines all transformed tables into one consolidated dataset. For better understanding, I encourage you to download the file and explore it yourself.
= Table.Combine(RenameColAllFiles[Content])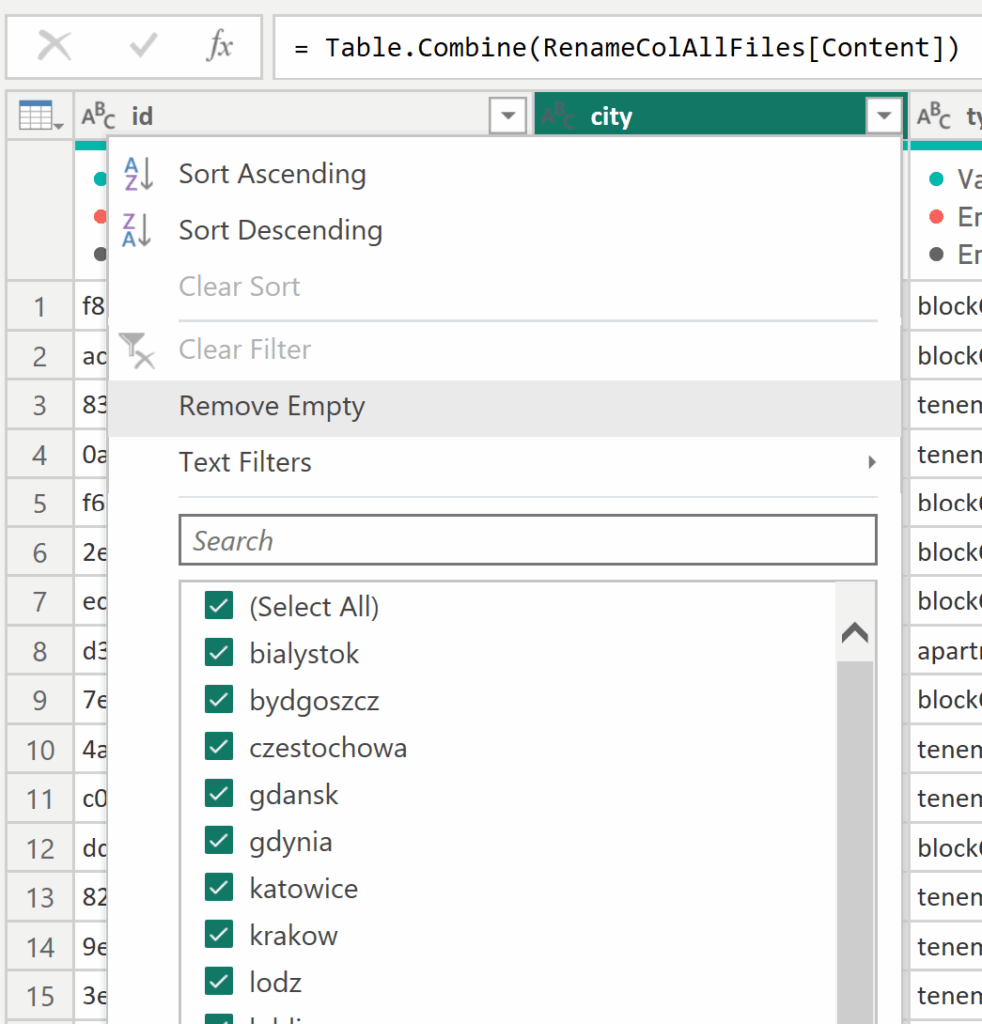
2️⃣ The “Missing Field” Option – Handling Absent Columns Gracefully
Second, did you know that Power Query can ignore missing columns without breaking your transformations?
Using the MissingField.Ignore option in M functions (like Table.AddColumn or Table.RemoveColumns) allows your query to skip errors when a specific column doesn’t exist.
✅ Why it matters:
In addition, this technique is especially useful when working with data sources that evolve over time or when collaborating across different dataset versions.
Therefore, it helps maintain query stability and prevents unexpected refresh failures.
Keyword focus: Power Query MissingField.Ignore, Power Query handle missing columns, Power BI M language tricks.
Example #2:
✅This is a quick but powerful trick, especially useful when columns might occasionally disappear from your files after transformations like renaming. Without it, you’d get an error. By adding the MissingField.Ignore option in the step where you rename columns, Power Query will skip missing columns—so even if some disappear during refresh, no errors will occur.
= Table.RenameColumns(#"Removed Columns",{{"price", "Total Price"}},
    MissingField.Ignore)
3️⃣ Removing the First N Rows – Even When N Is Unknown
Next, there are many cases where you need to remove the first few rows — for example, extra headers or metadata — but the number of those rows varies.
Instead of guessing, you can dynamically detect the number of rows to skip using M logic.
✅ Why it matters:
This dynamic solution ensures that your transformations remain valid even if file structures change.
Consequently, your data cleaning process stays stable, flexible, and free of manual adjustments.
Keyword focus: Power Query remove top rows dynamically, Power BI clean CSV files, Power Query automation.
Example #3:
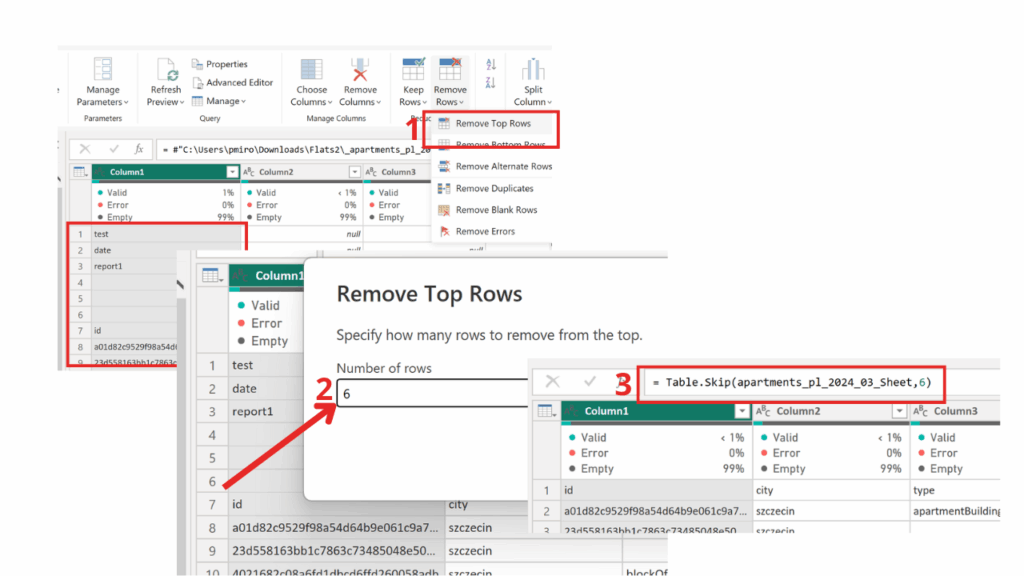
✅In this useful transformation, we’ll start by understanding how a basic modification works in such cases. To do this, we’ll manually force Power Query to skip the first few rows using available methods — just to see how it behaves. This is one of the best practices for checking whether a specific function needs additional input. After connecting to the folder and loading the first transformation, we can proceed with the next steps.
= Table.TransformColumns(
        Source,
        {"Content", each Excel.Workbook(_)}
    )
✅As we can see, after a simple modification in Power Query, the Table.Skip function appears in the formula bar. The first argument refers to the previous step, while the second defines the number of rows to skip. Following best practices in data transformation, our goal is to automate this step so that Power Query dynamically detects how many rows to skip for each file — since this value must remain variable.
✅Now it’s time to add the code that automates the number of rows to skip. While the script looks a bit longer, it’s actually quite simple.
✅We start by adding a new step and using the Table.TransformColumns function, referencing the previous transformation step. Next, we point to the „Content” column, which contains the Excel workbooks, and apply the function (wb as table) as table => wb to process each file.
✅Inside wb, we may find different objects, but we’re specifically interested in the Sheet. Since we want to work with the first worksheet, we use {0} and extract its data as a table with [Data].
✅The headers variable stores a list of column names that the user can either replace with their own or define in a separate list to make the code shorter and easier to manage.
= Table.TransformColumns(
        TransformColumn,
        {
            "Content",
            (wb as table) as table =>
                let
                    // select the worksheet; optionally match by [Item]
                    data   = Table.SelectRows(wb, each [Kind] = "Sheet"){0}[Data],

                    // define the expected header (as in your example)
                    headers = {"id","city","type","squareMeters","rooms","floor","floorCount","buildYear","latitude","longitude","centreDistance","poiCount","schoolDistance","clinicDistance","postOfficeDistance","kindergartenDistance","restaurantDistance","collegeDistance","pharmacyDistance","ownership","buildingMaterial","condition","hasParkingSpace","hasBalcony","hasElevator","hasSecurity","hasStorageRoom","price"},

                    // skip rows until the current row equals the headers (list comparison)
                    skipped = Table.Skip(
                                data,
                                each
                                    List.Transform(Record.FieldValues(_), each Text.Upper(Text.Trim(Text.From(_))))
                                    <>
                                    List.Transform(headers, each Text.Upper(_))
                              ),

                    // promote the header row
                    promoted = Table.PromoteHeaders(skipped, [PromoteAllScalars = true])
                in
                    promoted
        }
    )
✅The goal is to skip all rows until Power Query finds the correct header row — the one matching the defined list of column names.
✅Table.Skip(data, each …) skips rows while the condition holds true.
Record.FieldValues(_) extracts all values from the current row.
List.Transform(…, each Text.Upper(Text.Trim(Text.From(_)))) cleans the values by trimming spaces and converting them to uppercase for consistent comparison.
<> List.Transform(headers, each Text.Upper(_)) compares the current row to the expected headers; <> means “not equal.”
✅Finally, in just three steps, we’ve transformed the tables and removed unnecessary rows. Don’t forget to combine them now — use:
= Table.Combine(Custom1[Content])4️⃣ Remove Matching Rows – Compare and Clean Tables Effectively
Fifth, when comparing two tables (for instance, imported vs. reference data), you may want to remove rows that match across both.
The Table.RemoveMatchingRows function lets you easily identify non-matching records between datasets.
✅ Why it matters:
In addition, this function is perfect for data validation or tracking missing records after merges — especially in data reconciliation tasks.
As a result, users can clearly see what data didn’t match, ensuring transparency and quality control.
Keyword focus: Power Query remove matching rows, Power BI compare tables, Power Query data validation.
Example #4:
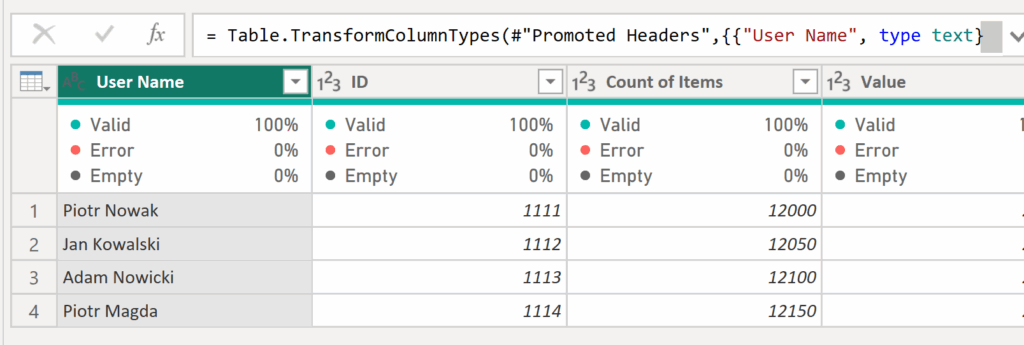
✅In this example, we have two sample tables — Table1 and Table2 — where Table2 is longer. We want to compare Table2 with Table1 and remove any rows that have the same User Name. To do this, create a separate query that references Table1.
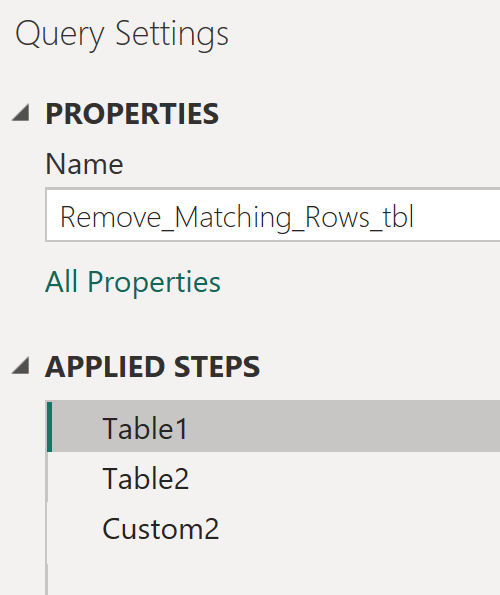
✅ Next, add a new step and reference Table2 by typing = Table2, then create another step and enter the following code:
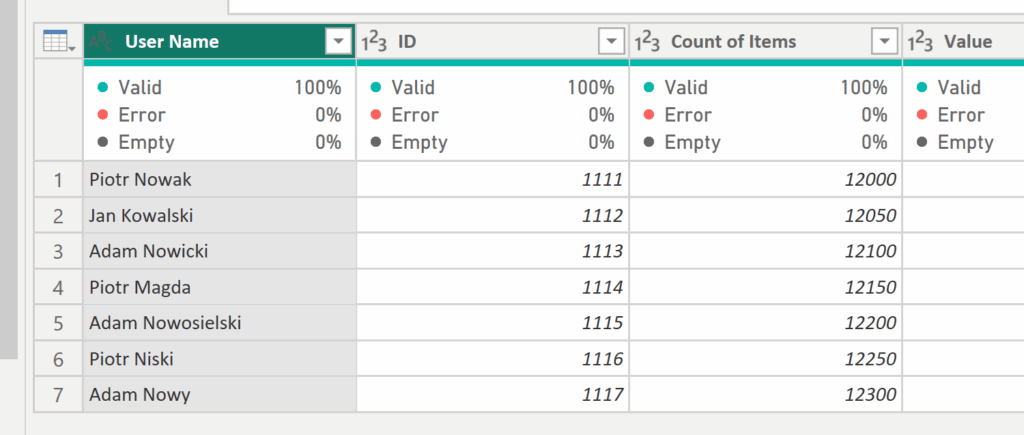
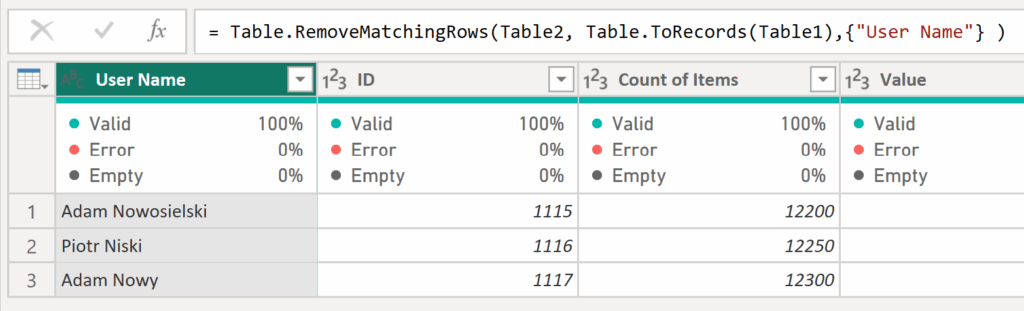
= Table.RemoveMatchingRows(Table2, Table.ToRecords(Table1),{"User Name"} )✅The final result of this formula displays Table2 with all rows removed that had the same User Name as in Table1.
5️⃣ Error Log Table – Find and Fix Issues Faster
Sixth, wouldn’t it be great to know where and why your query is failing?
Creating a dedicated error log table in Power Query can show you exactly which rows and columns contain errors.
This can be done by applying conditional transformations and leveraging functions like try...otherwise.
✅ Why it matters:
Furthermore, this method provides a structured view of all issues across your dataset.
Therefore, it’s a simple but powerful approach to debugging Power Query transformations and improving data quality monitoring.
Keyword focus: Power Query error handling, Power Query try otherwise, Power BI data quality.
Example #5:
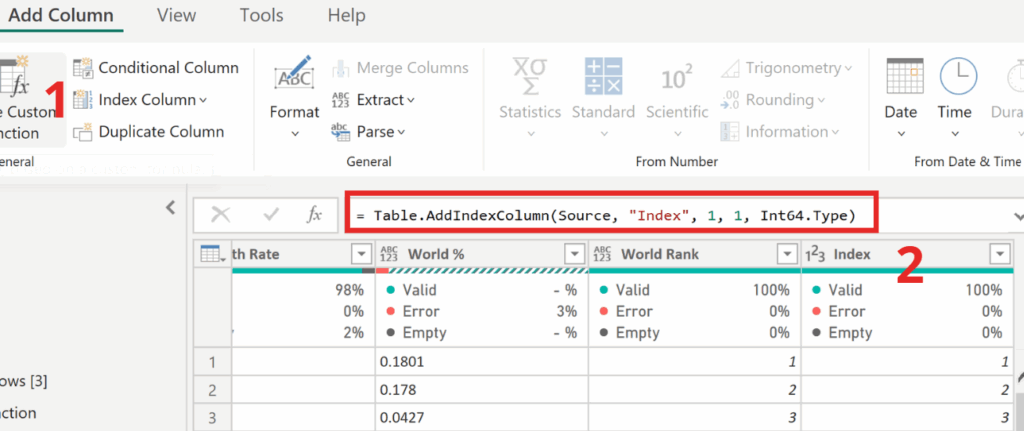
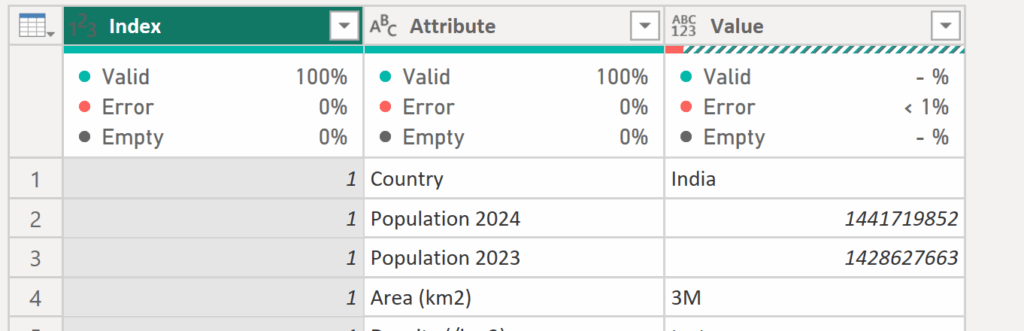
✅To create a table that will help us prepare a list of rows with errors for the data team, start by duplicating the loaded file using the “Reference” option instead of “Duplicate.” Then, add an Index column beginning at 1 — just like in the screenshot below.
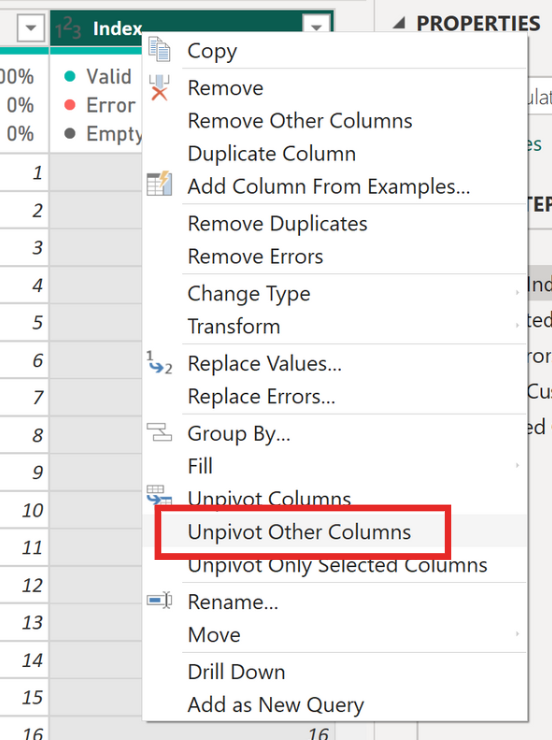
✅Next, select the Index column, right-click, and choose Unpivot Other Columns. Now your table should contain only three columns: Index, Attribute, and Value.
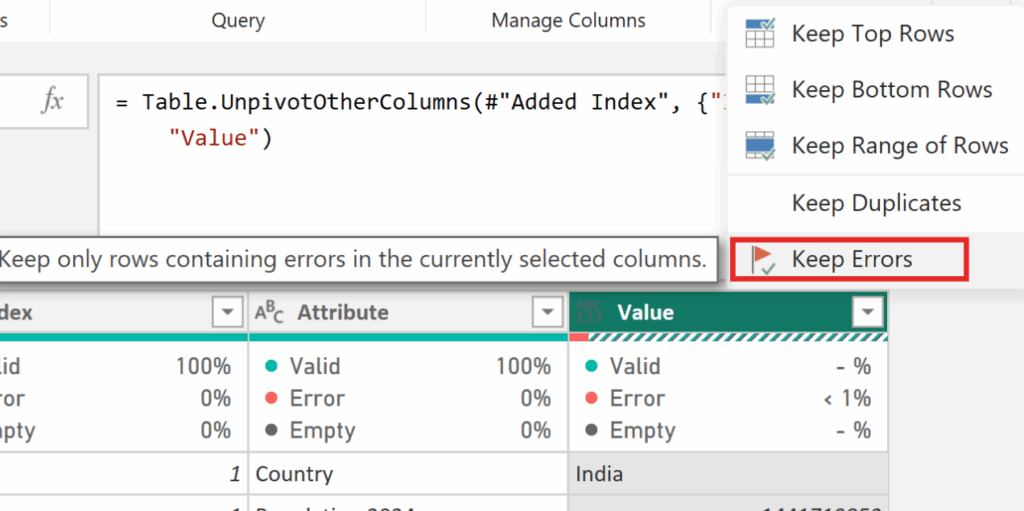
✅Next, to focus only on the items with errors, select the Value column and choose Keep Errors.
✅Let’s now explore what’s inside the Error objects. To do this, create a new column using the following code:
=(try [Value])[Error]✅After creating the column, you’ll see Record objects. By clicking the icon next to a cell, you can view their contents. Inside, you’ll find various details about the error — but what we’re most interested in is the message, which tells us what kind of error we’re dealing with.
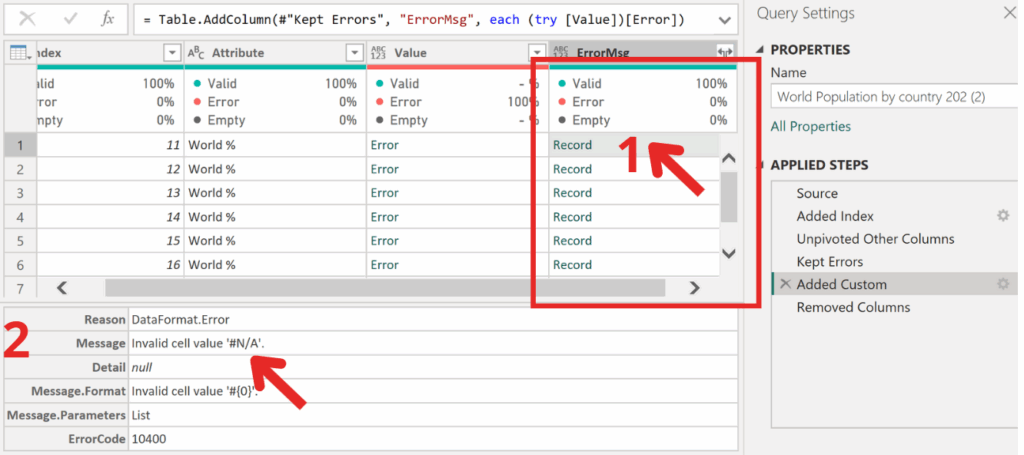
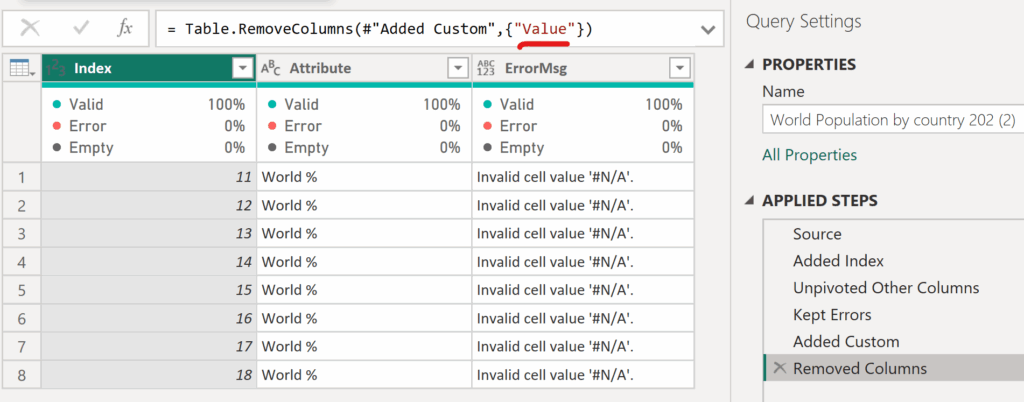
✅To display only the error information instead of all the details, go back to the column you created. Click the gear icon next to Add Custom Column and add [Message] to the code — as shown below.
=(try [Value])[Error][Message]✅Finally, we have the ready-to-use report for the data team — the last step is simply to remove the now unnecessary Value column containing the errors.
⚙️ Conclusion
To sum up, each of these techniques represents a small but impactful improvement in your Power Query workflow.
By mastering the M language and applying these strategies, you’ll not only automate repetitive tasks but also reduce refresh errors and improve the stability of your Power BI solutions.
Next time you open the Power Query Editor, try one of these M-based Power Shots — and see how much smoother your transformations become.
👉 Click and Grab the materials from my GitHub!
🧠 Related Reads
Click the link below the icon to learn how to remove duplicate items and keep only those with the most recent status.
https://www.instagram.com/reel/C-N03baItkh/?igsh=dTc1NWMwNjFsd2l3
👾 Problem: Duplicate entries with old statuses.
🎯 Solution: Keep only the latest and greatest!