

Let’s be honest: nothing kills the „wow” factor of a beautiful dashboard faster than a spinning loading icon. 🔄 We’ve all been there—you click a slicer, go to grab a coffee, and by the time you’re back, the visual is still thinking. Therefore, it is crucial to understand that a high-performing Power BI model isn’t just about pretty colors; it’s about clean architecture and lightning-fast Power BI Performance. ⚡
In consequence, if your reports feel sluggish, it’s time to stop guessing and start auditing. In this article, we will explore three „pro-level” ways to perform a professional Power BI report audit and transform your Power BI Performance game from „meh” to „masterpiece.”
Table of Contents
1. 🛠️ DAX Optimizer: The „Check Engine” Light for Your Model
First and foremost, let’s look at DAX Optimizer. Think of this tool as a professional mechanic for your data. You wouldn’t fix a modern car engine with just a screwdriver, right? You’d plug it into a computer. 💻 Similarly, a complex Power BI model requires automated precision to find hidden bottlenecks.
What’s the Magic?
Developed by the legends at SQLBI, this tool doesn’t just look at your formulas—it dissects the entire structure. Consequently, it is the gold standard for Power BI Performance.
- No more „voodoo” fixing: It tells you exactly which column is eating your memory. 🧠
- Severity Scoring: It ranks issues from „fix this now” to „nice to have.”
- Privacy First: It uses VPAX files, meaning your actual data stays on your machine. 🛡️
Step-by-step: Analyzing your model with DAX Optimizer
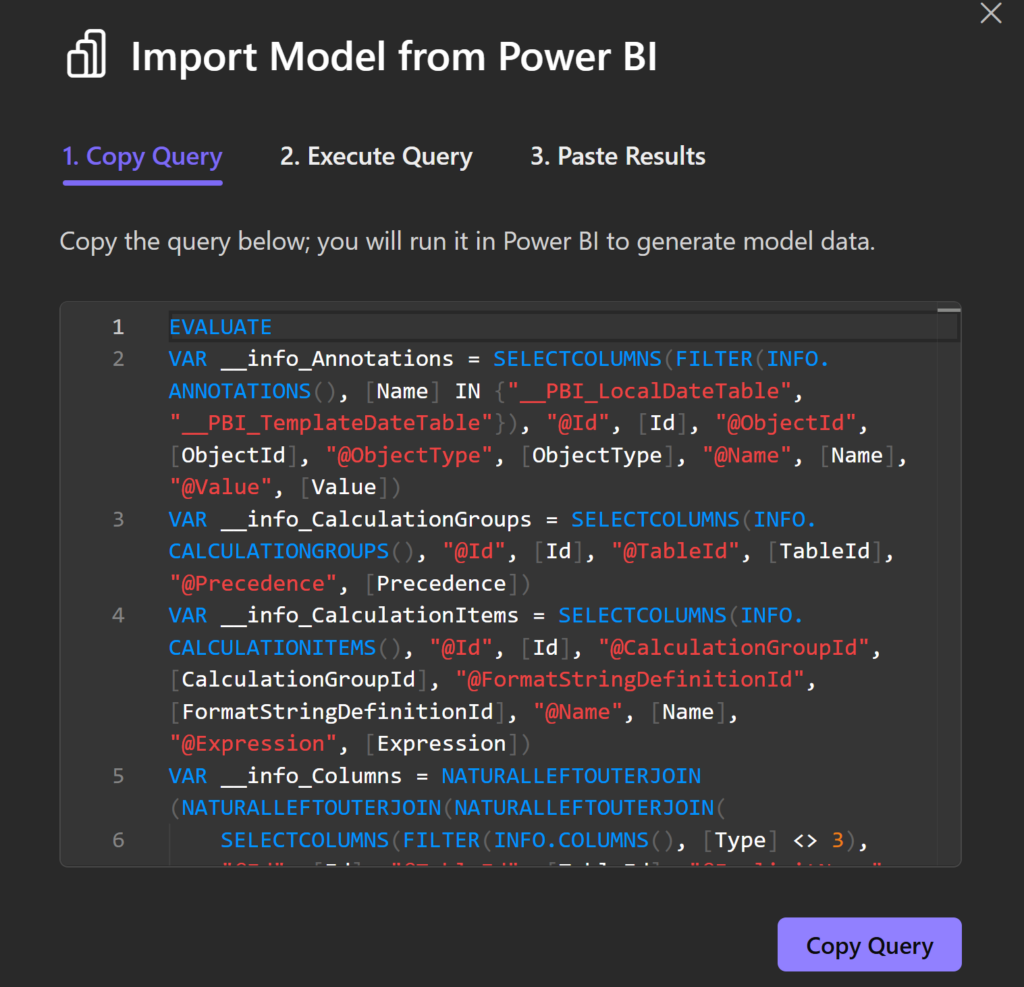
Go to daxoptimizer.com
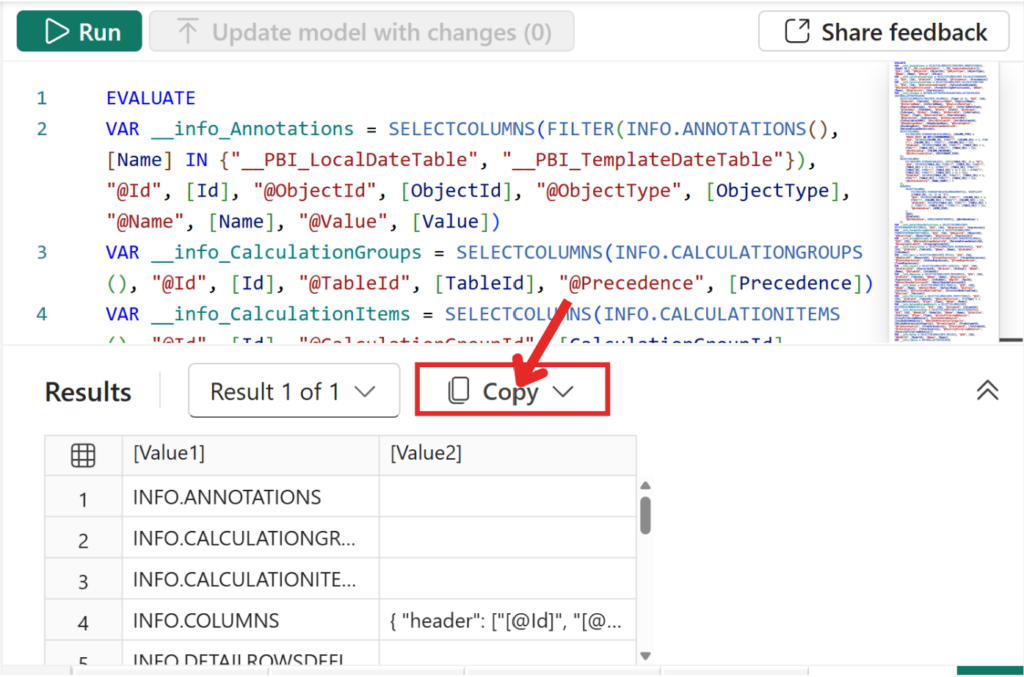
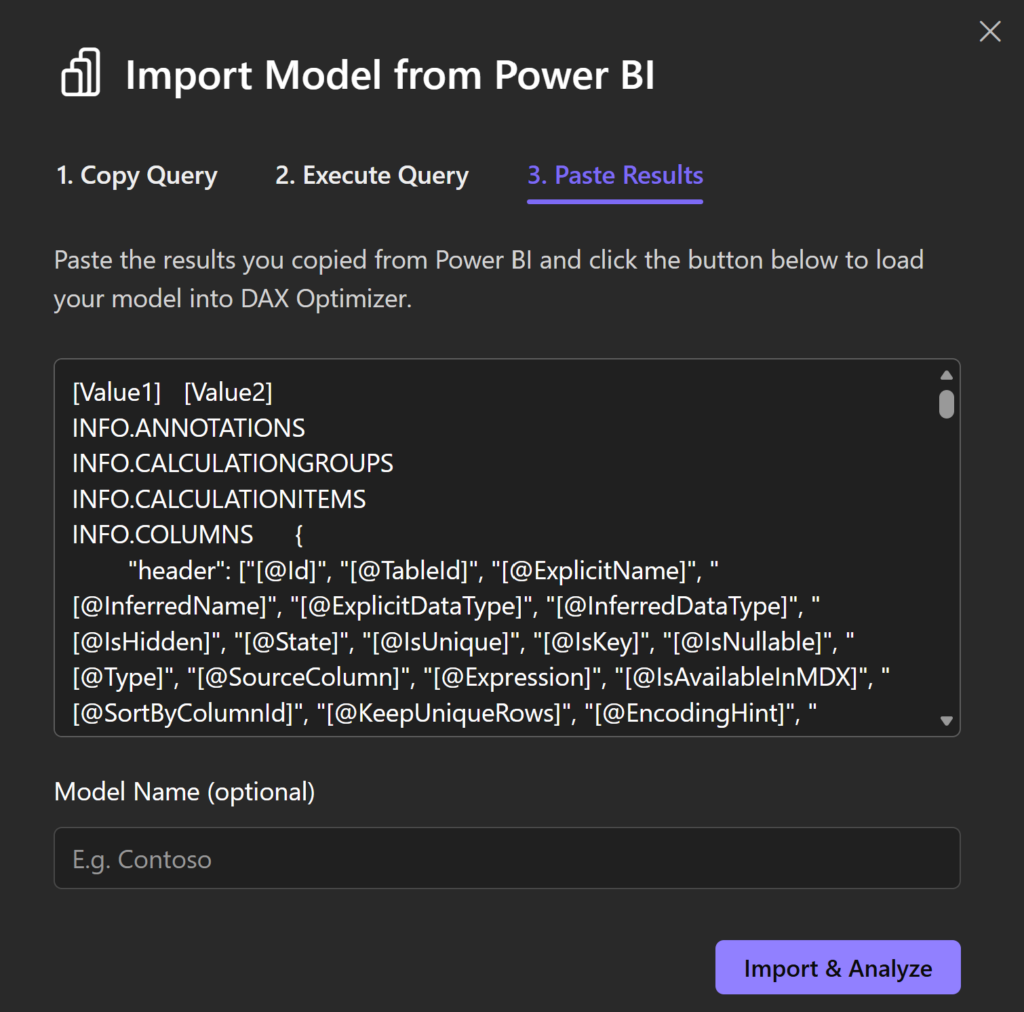
and select Free Access. After setting your region, copy the provided DAX query and paste it into the DAX query view in Power BI. Run the code, copy the resulting table, and paste it back into DAX Optimizer. Finally, click the analyze button to receive optimization tips for your model.
🔍 Note on diagnostics
I’m sharing the steps below in case they help you diagnose your Power BI model.
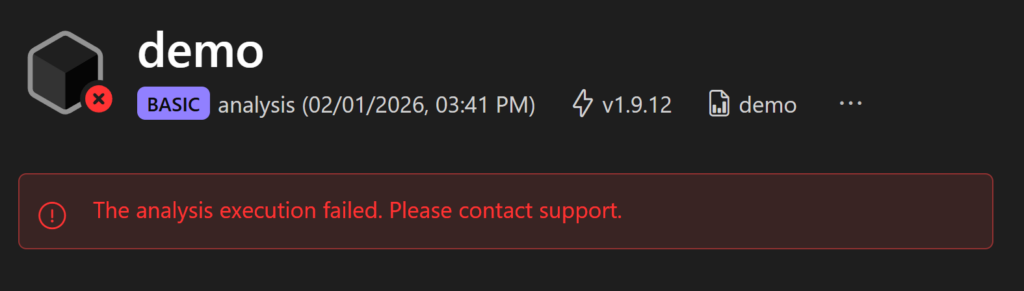
In my case, however, DAX Optimizer (Basic plan) failed immediately at the analysis stage, even though the model import (including VPAX) was successful. I reported this issue to the support team.
⚠️ The issue may be related to specific elements of my report, such as:
- 🧩 Field Parameters
- 🧮 advanced calculated tables
These features might not be fully supported in the Basic version of the tool.
To make the analysis run successfully, we first used ChatGPT to identify and remove parts of the model output that are not supported by DAX Optimizer (Basic). This step is not recommended for regular model validation, as removing elements from the model inevitably results in an incomplete view of its structure and logic. In this case, the adjustments were made purely to test the tool and understand its behavior.
In particular, advanced model features such as Field Parameters caused the analysis to fail at an early stage. Once these elements were excluded, the tool was able to complete the analysis and return optimization suggestions.
⚙️ What the Basic analysis provides
- The analysis focuses on a limited set of patterns
- Only a subset of measures is evaluated
- Feedback is mostly related to straightforward optimizations (for example, repeated measure evaluations)
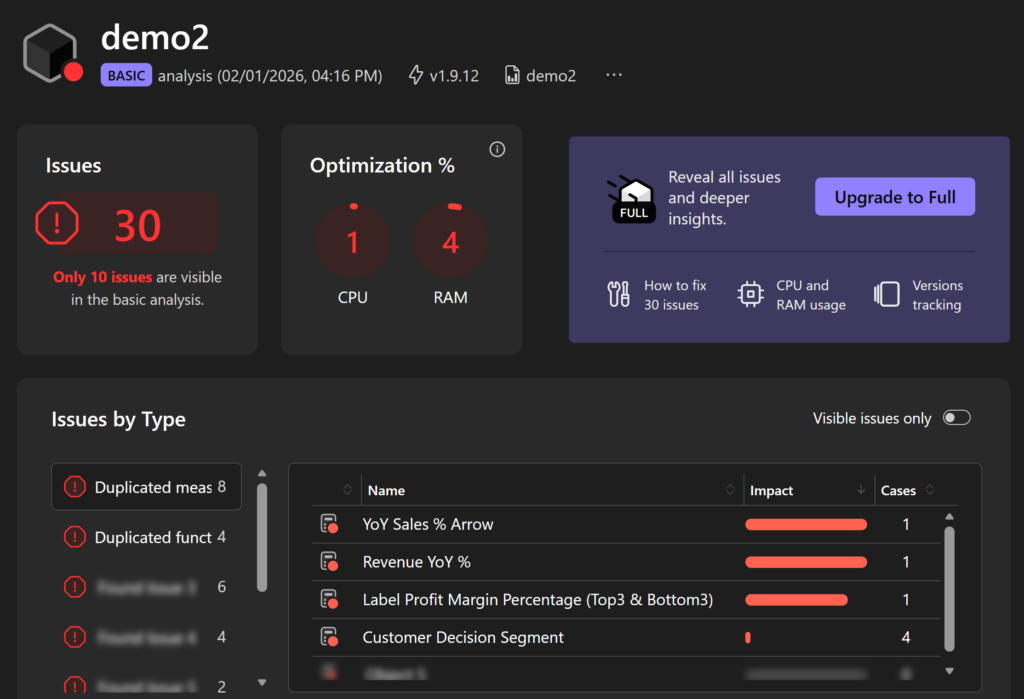
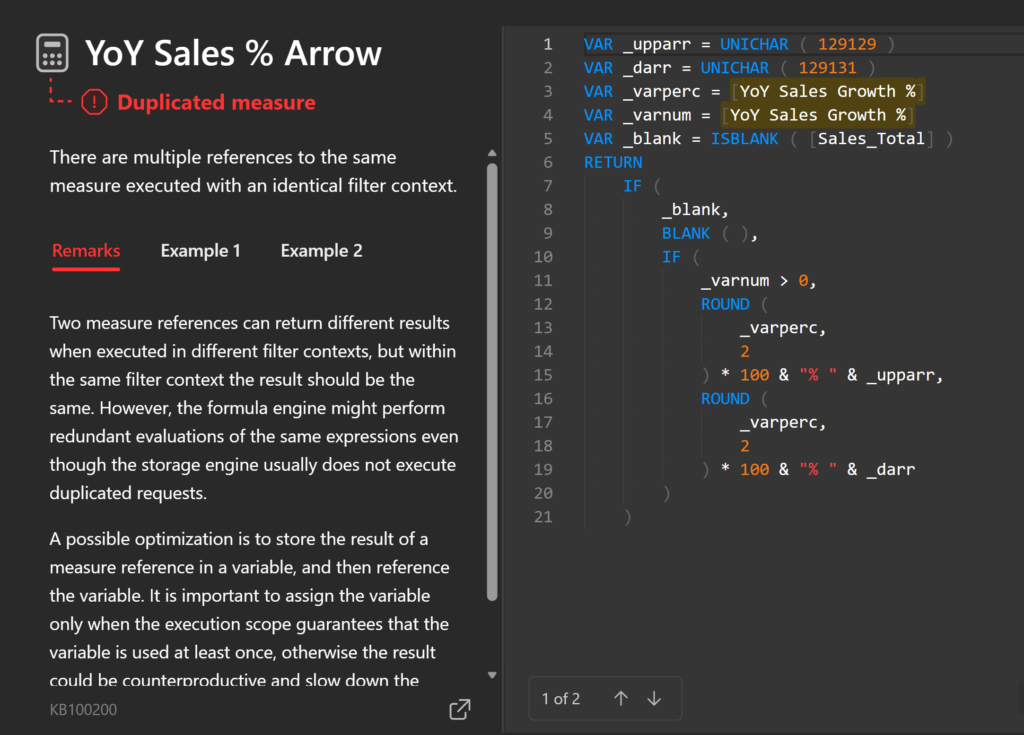
📸 The screenshot below shows one of the detected cases, including:
- the affected measure
- the explanation of the issue
- the suggested optimization pattern
💰 Access to full diagnostics
- A more comprehensive analysis is available via an additional paid option
- At the time of writing, the cost is $15
- For occasional or single-use scenarios, this pricing may be difficult to justify compared to the depth of insights provided in the Basic version
🔎BTW, I reported the original issue to the DAX Optimizer team and they got back to me very quickly. I now have access to the basic version with no issues and no workarounds needed. That being said, the basic version only covers roughly 25% of the issues, so it’s fairly limited.
🔎 Takeaway
DAX Optimizer can be a useful validation tool, but in its Basic form it should be treated as a lightweight sanity check rather than a full model performance review.
2. 🧪 BIM Info Code: Giving Your Model a DNA Test
In addition to automated tools, sometimes you need a custom approach. What if you could summarize your entire model into a single „cheat sheet” and hand it over to an AI genius? Specifically, thanks to a brilliant DAX trick by Brian Julius (Feb 2025), you can perform a deep Power BI model audit using metadata. 🧬
The Secret Sauce
Using the new INFO functions, we can generate a complete map of your Power BI model. In fact, it’s like taking an X-ray of your data relationships.
Copy-Paste This Magic 📋:
BIM Info =
VAR TableInfo =
    ADDCOLUMNS ( INFO.VIEW.TABLES (), "Component", "Tables" )
VAR ColumnInfo =
    ADDCOLUMNS ( INFO.VIEW.COLUMNS (), "Component", "Columns" )
VAR RelationshipInfo =
    ADDCOLUMNS ( INFO.VIEW.RELATIONSHIPS (), "Component", "Relationships" )
VAR MeasureInfo =
    ADDCOLUMNS ( INFO.VIEW.MEASURES (), "Component", "Measures" )
VAR Result =
    TOCSV ( TableInfo )
        & TOCSV ( ColumnInfo )
        & TOCSV ( RelationshipInfo )
        & TOCSV ( MeasureInfo )
RETURN
    Result
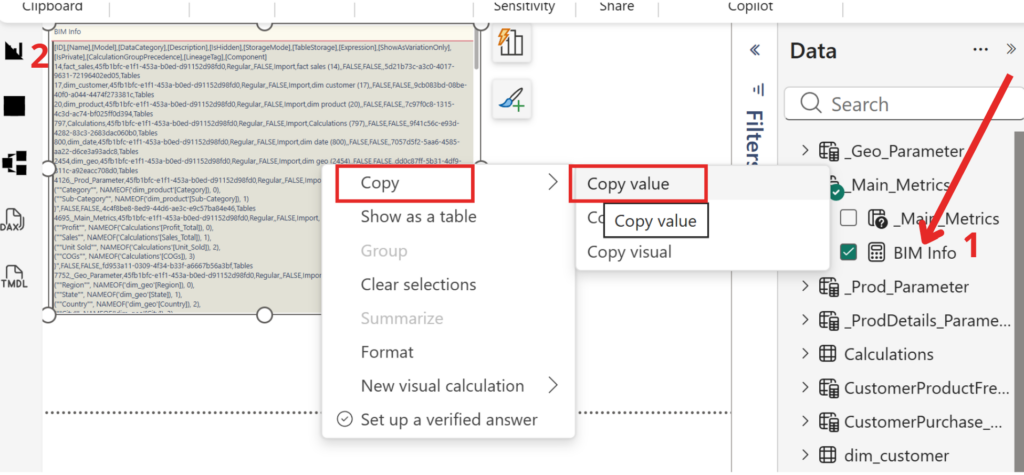
How to extract model metadata for evaluation:
- Create a New Measure: Copy the DAX code above and create a new measure in your Power BI file.
- Use a Table Visual: Drop this measure into a Table visual.
- Copy the Result: Right-click the value in the table and select „Copy value”.
- Paste to AI: Paste the result alongside the evaluation prompt.
Tip: This method allows the AI to see your actual table names, relationships, and model structure without sharing the sensitive data itself.
PROMPT:
„Act as a Senior Power BI Architect and Sales Analytics Expert. Evaluate my commercial data model. Review the table relationships (Star Schema vs Snowflake), data granularity, and DAX efficiency for sales-driven KPIs. Provide a concise 'Scorecard’ with strengths, critical performance bottlenecks (like O(n²) complexity), and 3 actionable tips to improve report responsiveness and data visualization for Sales Managers and Executives. Focus on customer behavior tracking, profit margins, and time-intelligence performance.”

3. 🌐 MCP + Claude: The „Future is Now” Method
Finally, we have the most modern approach: the Model Context Protocol (MCP). While the previous methods are great, MCP allows Claude AI to „talk” directly to your local environment. Instead of exporting files, you get real-time Power BI model audit.
Why this is a Game Changer:
- Context is King: Claude understands how your „Sales” table connects to „Geography” instantly. 🌍
- Real-time Debugging: You can chat with your model. „Claude, why is this measure slowing down the page?”
- Instant Optimization: It provides rewritten DAX and explains why the new version improves Power BI model Performance. 📈
What you need to run the AI validation (minimum setup)
To validate a Power BI model using MCP and Claude, you need:
- Claude Desktop – required to connect AI to local files (VPAX, model metadata, exported DAX)
👉 https://claude.ai/download - MCP (Model Context Protocol) – required to provide structured model context to the AI
👉 https://marketplace.visualstudio.com/items?itemName=analysis-services.powerbi-modeling-mcp
Setup instructions are available on YouTube.
I used this guide:
👉 Claude + Power BI Integration 🧠 MASSIVE Breakthrough via MCP 💥 (Nov 2025 Update)
Claude Web alone is not sufficient if you want to work directly with local files.
Once Claude Desktop and MCP are installed, you can pass your Power BI model artifacts to the AI and run the validation prompts.
Step 1 – Initial prompt
First, ask the AI to connect to the currently open Power BI file and read the model metadata.
Example prompt:
PROMPT 1:
“Connect to the currently open Power BI file and load the model metadata for analysis.”
PROMPT 2:
„You are a senior Power BI reviewer.
Analyze this Power BI report/model and assess its overall quality.
Focus on data model structure, relationships, measures, performance risks, and maintainability.I am not looking for best-practice theory, but for a practical validation:
– what looks solid
– what looks risky
– what may cause performance or scalability issues laterAssume the report currently works correctly.”
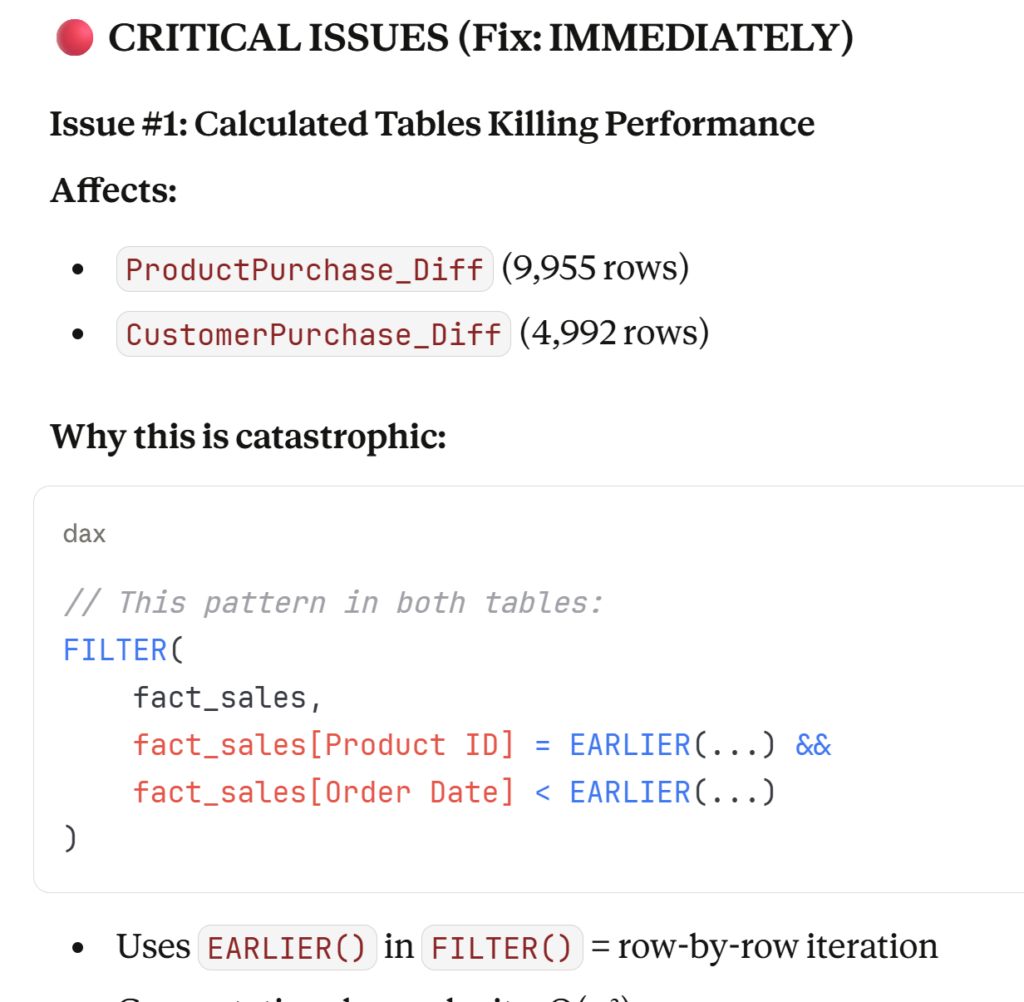
Below is a screenshot from the results of our analysis.
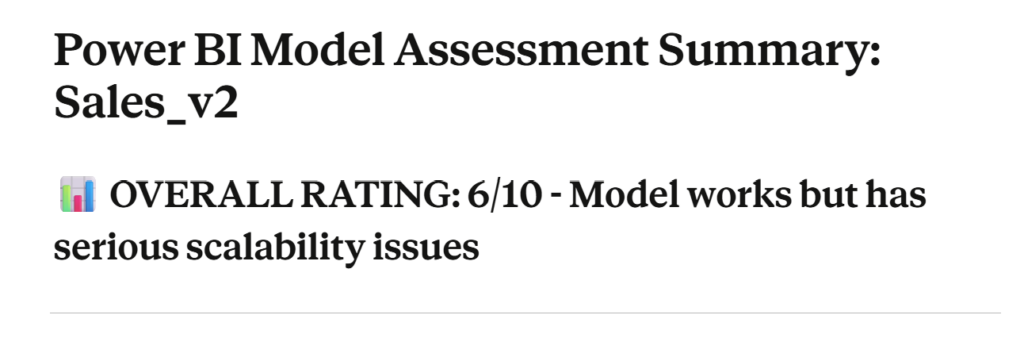
This time, the overall score is lower than in previous evaluations — but that’s actually a good thing. In exchange, we receive a highly detailed and practical improvement plan that can be exported, for example, as a notebook or structured notes.
What makes this especially valuable is the clarity of the recommendations:
- 🚨 Immediate actions – fixes for the most critical performance bottlenecks
- ⚙️ High-impact optimizations – eliminating the most inefficient patterns in the model
- 🕒 Deferred improvements – changes that can safely wait and be planned later
From a Power BI developer’s perspective, this is an excellent learning exercise. The analysis doesn’t just point out what is wrong — it explains why certain design choices hurt performance and how to write more efficient measures going forward. Just as importantly, it shows which patterns are best avoided in future models.
📊 Summary: Is Your Model Good Enough?
I strongly encourage you to test your own models. We explored three different methods; not all of them are suitable for corporate environments (MCP is a good example here), but even the first approach alone can deliver real value and significantly improve your understanding of Power BI performance tuning.
Treat it as a playground, a diagnostic tool, and a learning accelerator — all in one.
In conclusion, a „good enough” Power BI model is a ticking time bomb. Therefore, don’t wait for the report to break—Start your Power BI model audit today!
Ready to give your model a tune-up? Would you like me to help you analyze a specific DAX measure that’s giving you trouble, or should we walk through how to set up the MCP connection for your next audit? 👇